Across the US, Speeding Tickets Drive Up Insurance Costs by $550+ a Year


A speeding ticket doesn’t just cost you in fines. It can drive up your car insurance premiums for years.
An analysis of average premiums across the U.S. found that a ticket for driving 11 to 15 mph over the speed limit costs drivers an average of hundreds of dollars more annually. The increase varies considerably by state and driver age.
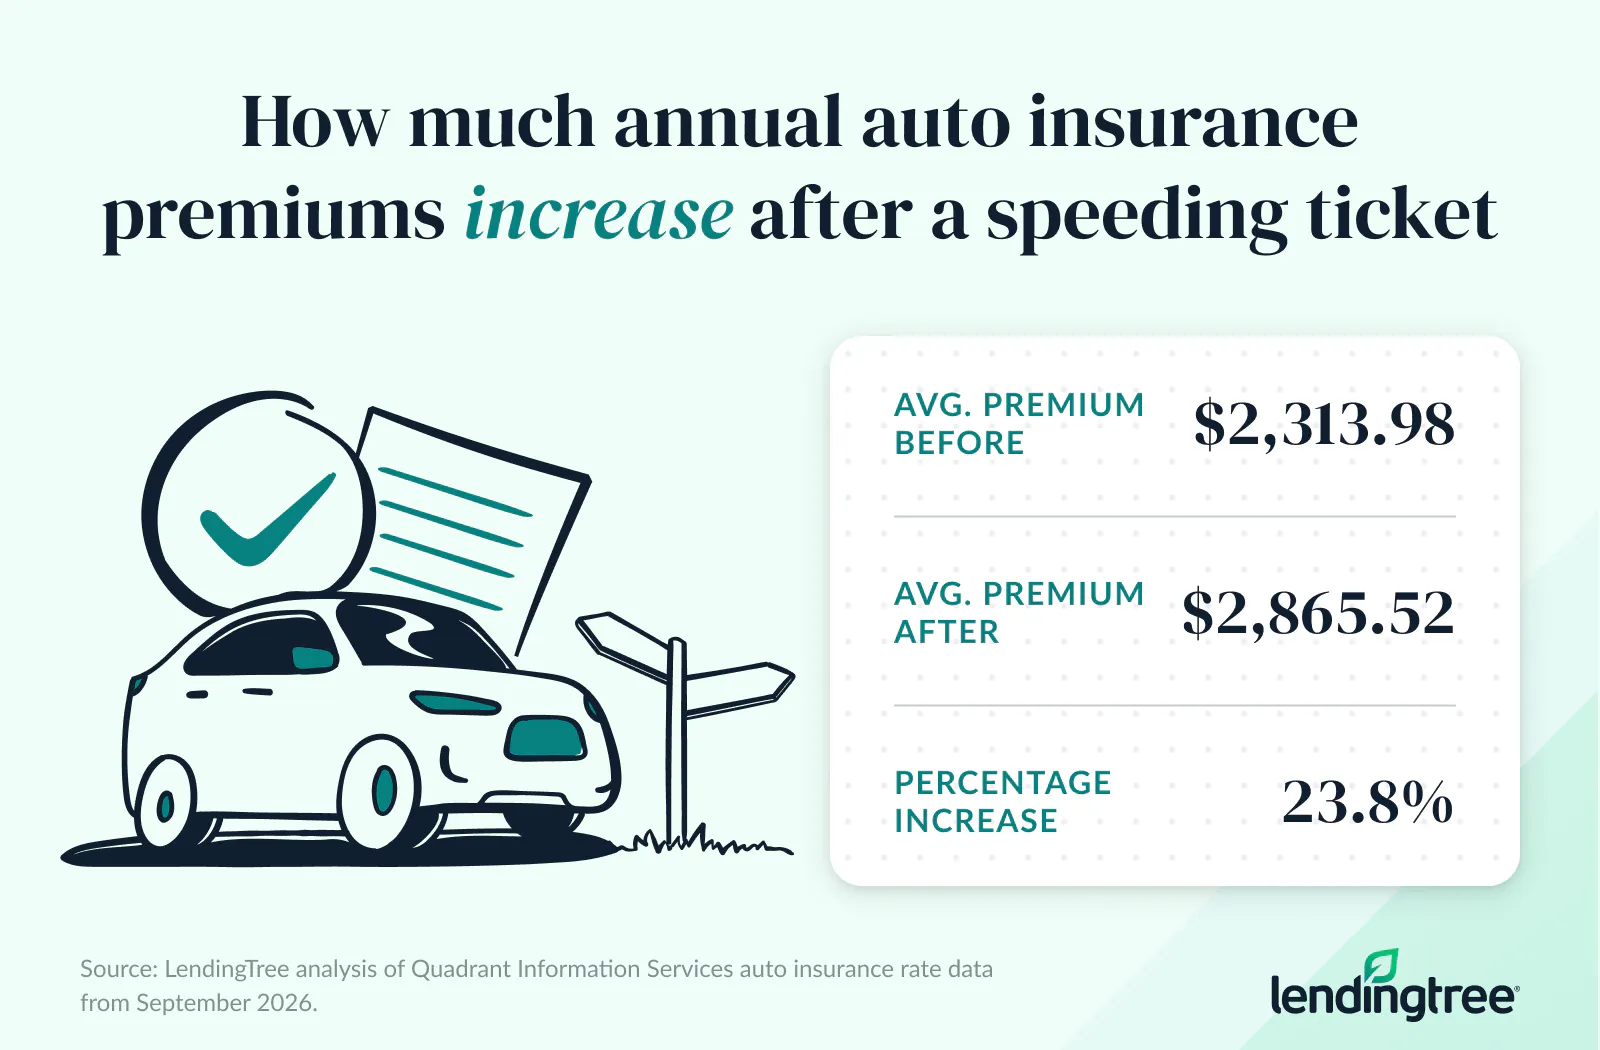
- Across the U.S., drivers pay an average of 23.8% more for auto insurance after receiving a speeding ticket. Average annual premiums rise from $2,313.98 to $2,865.52 after a ticket for driving 11 to 15 mph over the posted speed limit.
- Nationally, a speeding ticket adds an average of $551.54 a year, or $45.96 a month, to a driver’s insurance bill. Over three years, the added cost totals $1,654.61.
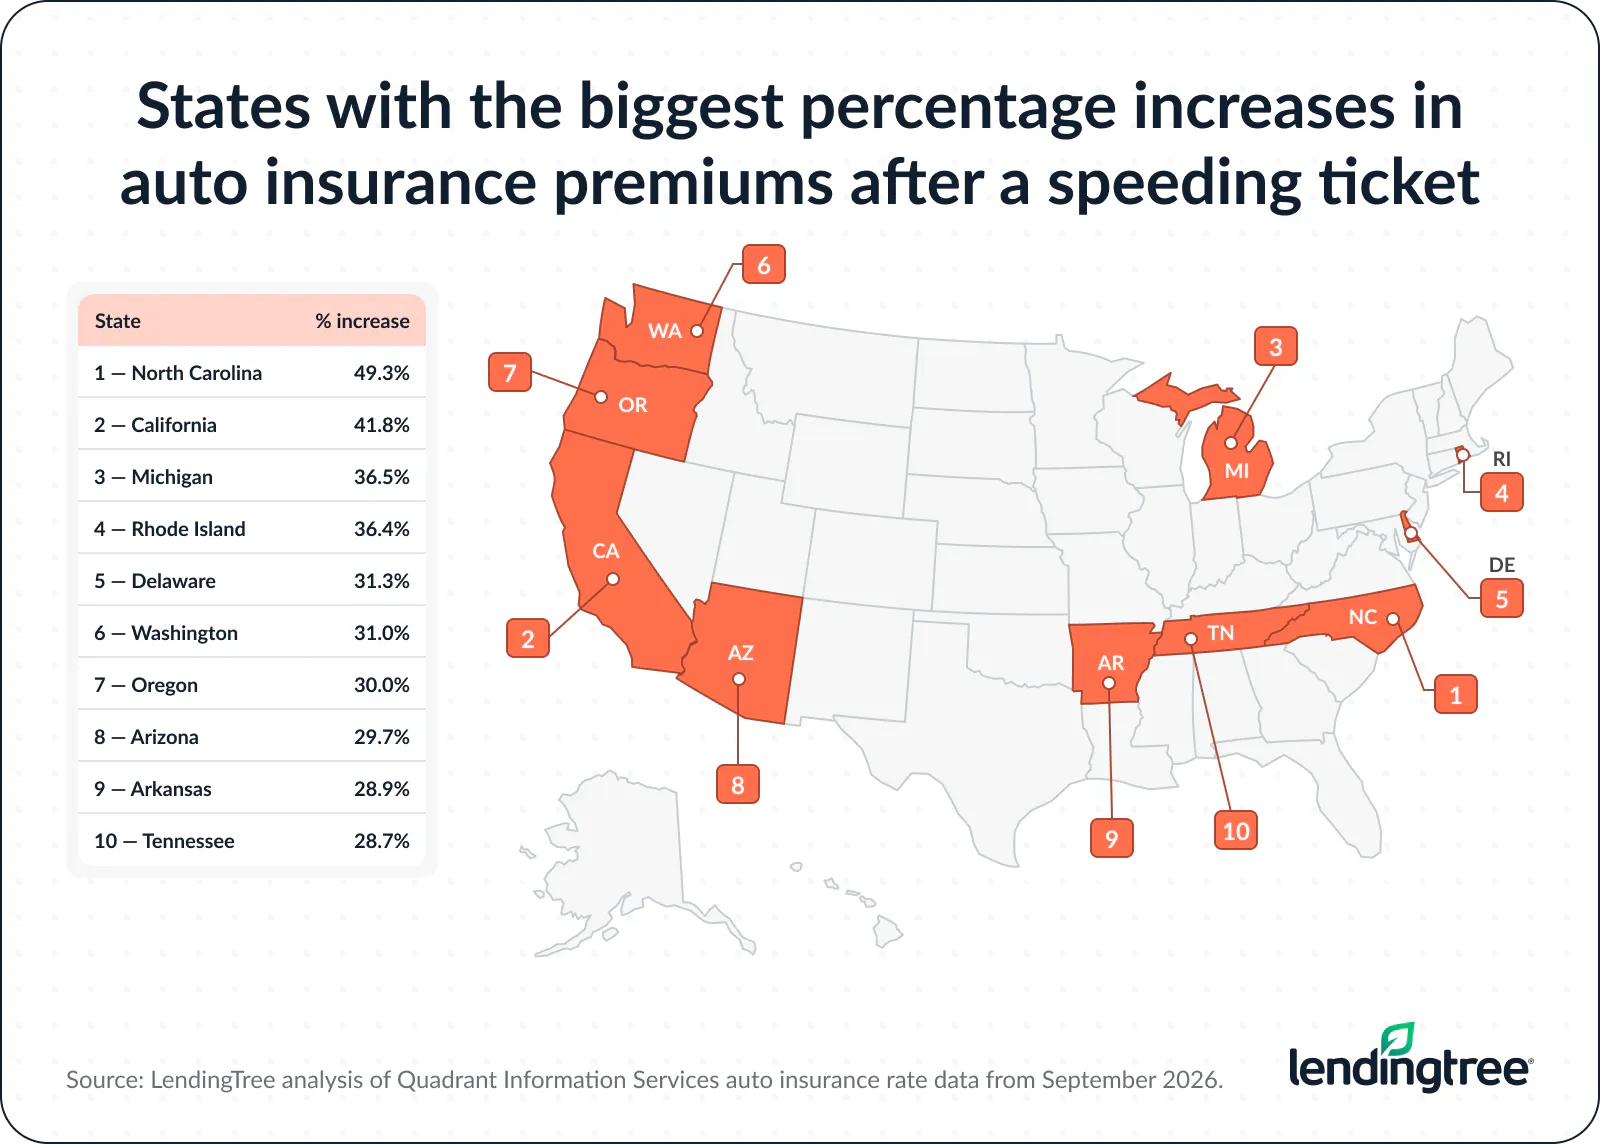
- North Carolina has the biggest percentage increase after a speeding ticket. Average premiums rise 49.3%, from $1,173.50 to $1,752.25, followed by California at 41.8% and Michigan at 36.5%.
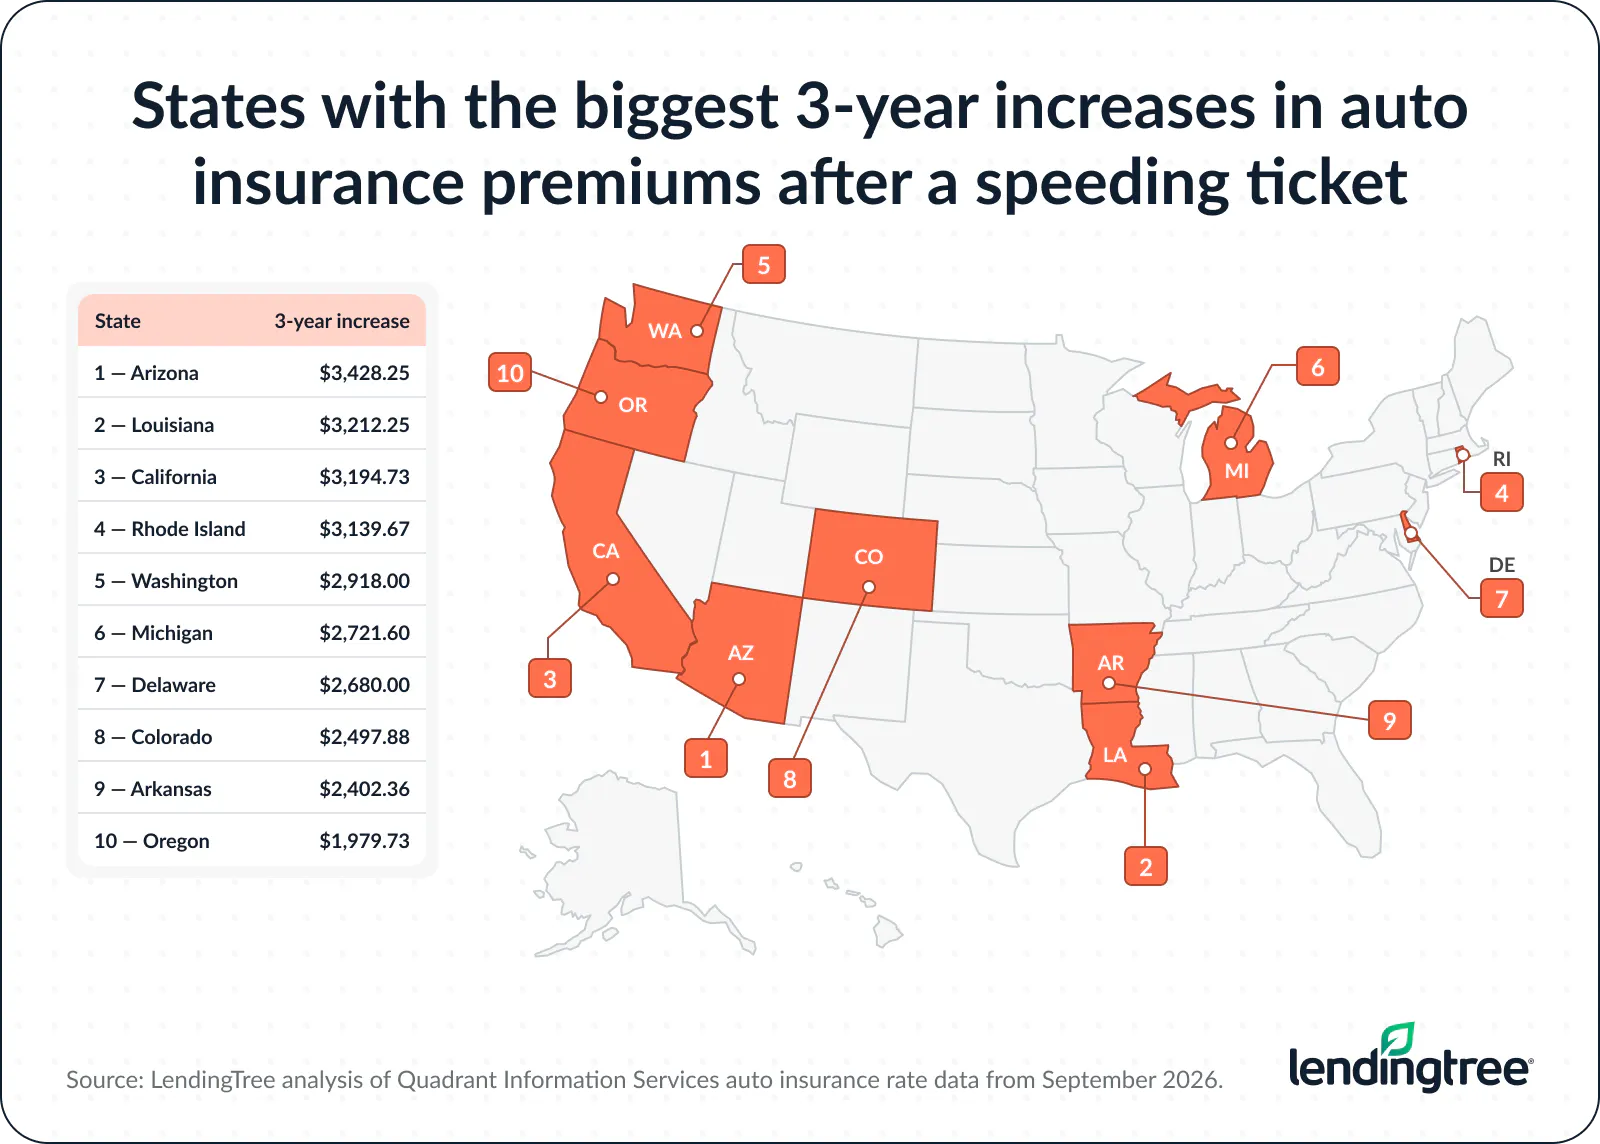
- Arizona has the biggest dollar increase, at $1,142.75 annually. Louisiana follows at $1,070.75 and California at $1,064.91.
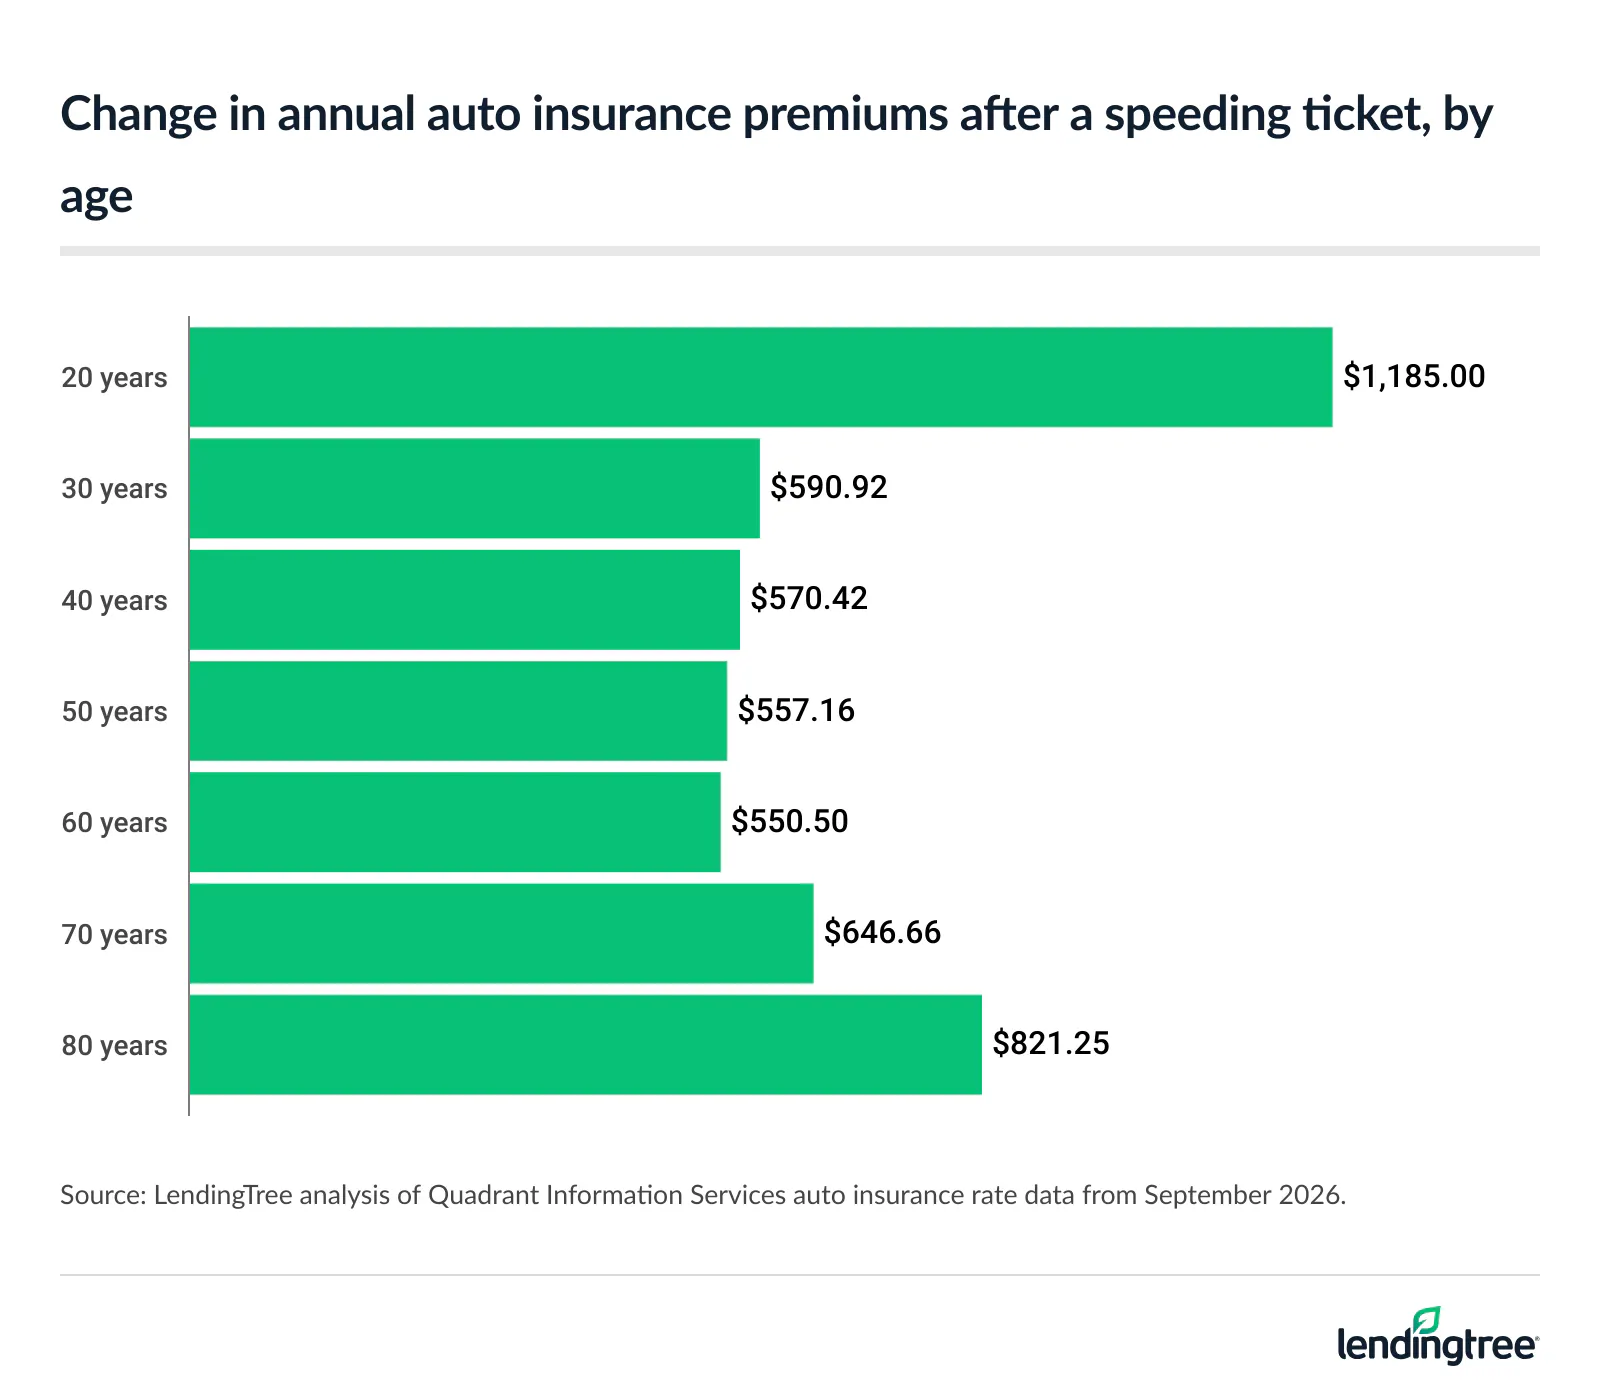
- 20-year-old drivers face the largest dollar increase after a speeding ticket, with average annual premiums rising by $1,185.00. Percentage increases are relatively similar across the age groups analyzed, ranging from 27.4% for 30-year-olds to 31.4% for 70-year-olds.
A single speeding ticket raises premiums by nearly 24% on average
Nationwide, a driver ticketed for going 11 to 15 mph over the speed limit sees their average annual premium climb 23.8%, from $2,313.98 to $2,865.52.
LendingTree auto insurance expert and licensed insurance agent Rob Bhatt says insurers treat a ticket as a signal of increased risk.
“Insurers generally view drivers with a recent speeding ticket as more likely to be in an accident than those with clean records,” he says. “A car insurance rate reflects how likely you are to file a claim, and in an insurer’s eyes, a recent speeding ticket puts you in a group with an elevated crash risk.”
The extra cost works out to $45.96 a month and can last for years
A speeding ticket adds an average of $551.54 a year, or $45.96 a month, to insurance premiums. Over three years, the added cost totals $1,654.61.
Bhatt says insurers typically need to see several years of safe driving before lowering rates after a ticket. “Insurers view a recent ticket as a sign of risky driving, though that doesn’t mean everyone who gets one will crash,” he says. “It usually takes a few years of incident-free driving after a ticket for insurance companies to see that you are, in fact, a safe driver after all.”
North Carolina drivers see the steepest percentage jump
The impact of a speeding ticket varies widely by state. North Carolina has the largest percentage increase, with average premiums rising 49.3%, from $1,173.50 to $1,752.25. California follows at 41.8%, then Michigan at 36.5%.
At the other end, Florida drivers see the smallest percentage increase, at 9.6%. Average premiums rise from $3,240.14 to $3,552.71. New York and New Jersey are close behind at 11.4% and 11.5%, respectively.
Why does the same violation have such different effects? Bhatt points to two possible factors, though he cautions that he doesn’t have access to insurers’ rate-setting data.
“The first is loss experience,” he says. “Insurers set rates in each state largely based on the losses and claims they pay out there, so if ticketed drivers in a state crash at higher-than-normal rates, their premiums will rise by a higher-than-normal amount. The second is state regulation. In some states, insurers can’t use a person’s credit history to set car insurance rates. Where that’s the case, there are fewer other factors available to offset the effect of a speeding ticket.”
Full rankings: States with the biggest percentage increases in auto insurance premiums after a speeding ticket
| Rank | State | Avg. annual premium before | Avg. annual premium after | % increase |
|---|---|---|---|---|
| 1 | North Carolina | $1,173.50 | $1,752.25 | 49.3% |
| 2 | California | $2,546.73 | $3,611.64 | 41.8% |
| 3 | Michigan | $2,486.90 | $3,394.10 | 36.5% |
| 4 | Rhode Island | $2,874.11 | $3,920.67 | 36.4% |
| 5 | Delaware | $2,857.22 | $3,750.56 | 31.3% |
| 6 | Washington | $3,141.00 | $4,113.67 | 31.0% |
| 7 | Oregon | $2,201.18 | $2,861.09 | 30.0% |
| 8 | Arizona | $3,845.58 | $4,988.33 | 29.7% |
| 9 | Arkansas | $2,767.29 | $3,568.07 | 28.9% |
| 10 | Tennessee | $1,997.46 | $2,571.55 | 28.7% |
| 11 | Iowa | $2,096.54 | $2,682.85 | 28.0% |
| 12 | Maine | $1,322.20 | $1,688.10 | 27.7% |
| 13 | Kansas | $2,224.15 | $2,838.00 | 27.6% |
| 14 | Illinois | $2,155.00 | $2,745.92 | 27.4% |
| 15 | Wisconsin | $1,847.75 | $2,351.17 | 27.2% |
| 16 | Pennsylvania | $2,151.20 | $2,726.80 | 26.8% |
| 17 | Virginia | $1,650.10 | $2,085.70 | 26.4% |
| 18 | Colorado | $3,209.13 | $4,041.75 | 25.9% |
| 19 | Louisiana | $4,155.88 | $5,226.63 | 25.8% |
| 20 | Alabama | $2,296.27 | $2,874.18 | 25.2% |
| 21 | North Dakota | $1,889.46 | $2,356.18 | 24.7% |
| 22 | Massachusetts | $1,801.00 | $2,235.69 | 24.1% |
| 23 | Idaho | $1,551.09 | $1,920.91 | 23.8% |
| 24 | New Hampshire | $1,555.90 | $1,920.00 | 23.4% |
| 25 | Nevada | $2,646.77 | $3,259.77 | 23.2% |
| 25 | Wyoming | $1,324.83 | $1,632.00 | 23.2% |
| 27 | South Dakota | $2,005.58 | $2,468.83 | 23.1% |
| 28 | Ohio | $1,640.82 | $2,017.55 | 23.0% |
| 28 | Utah | $2,249.90 | $2,766.60 | 23.0% |
| 30 | Indiana | $1,648.36 | $2,024.18 | 22.8% |
| 31 | Minnesota | $2,225.67 | $2,724.67 | 22.4% |
| 31 | New Mexico | $2,446.57 | $2,993.43 | 22.4% |
| 33 | Maryland | $2,648.67 | $3,226.78 | 21.8% |
| 34 | Nebraska | $2,207.92 | $2,684.67 | 21.6% |
| 35 | Missouri | $2,493.75 | $3,022.67 | 21.2% |
| 36 | Alaska | $1,958.00 | $2,371.50 | 21.1% |
| 36 | District of Columbia | $3,041.20 | $3,683.20 | 21.1% |
| 38 | West Virginia | $1,669.00 | $2,017.22 | 20.9% |
| 39 | Connecticut | $2,819.80 | $3,405.00 | 20.8% |
| 40 | Oklahoma | $2,324.10 | $2,806.20 | 20.7% |
| 41 | Mississippi | $2,076.64 | $2,502.73 | 20.5% |
| 42 | South Carolina | $1,942.22 | $2,306.67 | 18.8% |
| 43 | Montana | $2,309.86 | $2,742.57 | 18.7% |
| 44 | Hawaii | $1,518.71 | $1,773.29 | 16.8% |
| 45 | Georgia | $3,034.71 | $3,535.71 | 16.5% |
| 46 | Vermont | $1,381.00 | $1,608.10 | 16.4% |
| 47 | Kentucky | $2,224.91 | $2,576.36 | 15.8% |
| 48 | Texas | $2,694.50 | $3,032.25 | 12.5% |
| 49 | New Jersey | $3,479.55 | $3,879.55 | 11.5% |
| 50 | New York | $2,963.27 | $3,301.55 | 11.4% |
| 51 | Florida | $3,240.14 | $3,552.71 | 9.6% |
Arizona has the biggest dollar increase, while Vermont has the smallest
Measured in dollars rather than percentages, Arizona drivers face the largest increase. A ticket adds $95.23 a month, or $1,142.75 a year, to their premiums. Louisiana follows at $1,070.75 annually, and California ranks third at $1,064.91.
Over three years, these additional premiums total $3,428.25 in Arizona, $3,212.25 in Louisiana and $3,194.73 in California.
Drivers in some states face much smaller increases. Vermont has the smallest at $18.93 a month or $227.10 a year, followed by Hawaii at $254.57 annually and Wyoming at $307.17. Florida is the only other state where the additional premiums total less than $1,000 over three years.
Full rankings: States with the biggest 3-year increases in auto insurance premiums after a speeding ticket
| Rank | State | Monthly increase after ticket | Annual increase after ticket | 3-year increase after ticket |
|---|---|---|---|---|
| 1 | Arizona | $95.23 | $1,142.75 | $3,428.25 |
| 2 | Louisiana | $89.23 | $1,070.75 | $3,212.25 |
| 3 | California | $88.74 | $1,064.91 | $3,194.73 |
| 4 | Rhode Island | $87.21 | $1,046.56 | $3,139.67 |
| 5 | Washington | $81.06 | $972.67 | $2,918.00 |
| 6 | Michigan | $75.60 | $907.20 | $2,721.60 |
| 7 | Delaware | $74.44 | $893.33 | $2,680.00 |
| 8 | Colorado | $69.39 | $832.63 | $2,497.88 |
| 9 | Arkansas | $66.73 | $800.79 | $2,402.36 |
| 10 | Oregon | $54.99 | $659.91 | $1,979.73 |
| 11 | District of Columbia | $53.50 | $642.00 | $1,926.00 |
| 12 | Kansas | $51.15 | $613.85 | $1,841.54 |
| 13 | Nevada | $51.08 | $613.00 | $1,839.00 |
| 14 | Illinois | $49.24 | $590.92 | $1,772.75 |
| 15 | Iowa | $48.86 | $586.31 | $1,758.92 |
| 16 | Connecticut | $48.77 | $585.20 | $1,755.60 |
| 17 | North Carolina | $48.23 | $578.75 | $1,736.25 |
| 18 | Maryland | $48.18 | $578.11 | $1,734.33 |
| 19 | Alabama | $48.16 | $577.91 | $1,733.73 |
| 20 | Pennsylvania | $47.97 | $575.60 | $1,726.80 |
| 21 | Tennessee | $47.84 | $574.09 | $1,722.27 |
| 22 | New Mexico | $45.57 | $546.86 | $1,640.57 |
| 23 | Missouri | $44.08 | $528.92 | $1,586.75 |
| 24 | Utah | $43.06 | $516.70 | $1,550.10 |
| 25 | Wisconsin | $41.95 | $503.42 | $1,510.25 |
| 26 | Georgia | $41.75 | $501.00 | $1,503.00 |
| 27 | Minnesota | $41.58 | $499.00 | $1,497.00 |
| 28 | Oklahoma | $40.18 | $482.10 | $1,446.30 |
| 29 | Nebraska | $39.73 | $476.75 | $1,430.25 |
| 30 | North Dakota | $38.89 | $466.73 | $1,400.18 |
| 31 | South Dakota | $38.60 | $463.25 | $1,389.75 |
| 32 | Virginia | $36.30 | $435.60 | $1,306.80 |
| 33 | Massachusetts | $36.22 | $434.69 | $1,304.08 |
| 34 | Montana | $36.06 | $432.71 | $1,298.14 |
| 35 | Mississippi | $35.51 | $426.09 | $1,278.27 |
| 36 | Alaska | $34.46 | $413.50 | $1,240.50 |
| 37 | New Jersey | $33.33 | $400.00 | $1,200.00 |
| 38 | Ohio | $31.39 | $376.73 | $1,130.18 |
| 39 | Indiana | $31.32 | $375.82 | $1,127.45 |
| 40 | Idaho | $30.82 | $369.82 | $1,109.45 |
| 41 | Maine | $30.49 | $365.90 | $1,097.70 |
| 42 | South Carolina | $30.37 | $364.45 | $1,093.34 |
| 43 | New Hampshire | $30.34 | $364.10 | $1,092.30 |
| 44 | Kentucky | $29.29 | $351.46 | $1,054.37 |
| 45 | West Virginia | $29.02 | $348.22 | $1,044.67 |
| 46 | New York | $28.19 | $338.27 | $1,014.82 |
| 47 | Texas | $28.15 | $337.75 | $1,013.25 |
| 48 | Florida | $26.05 | $312.57 | $937.71 |
| 49 | Wyoming | $25.60 | $307.17 | $921.50 |
| 50 | Hawaii | $21.21 | $254.57 | $763.72 |
| 51 | Vermont | $18.93 | $227.10 | $681.30 |
20-year-olds face the largest dollar increase
Age matters, too. Twenty-year-old drivers see the biggest dollar increase after a speeding ticket, with annual premiums rising by $1,185.00. They also have the highest average premiums among the age groups analyzed, rising from $4,157.00 annually before a ticket to $5,342.00 afterward.
By comparison, 80-year-old drivers see an increase of $821.25, with average premiums rising from $2,663.92 to $3,485.17.
Bhatt says young drivers are especially affected because they already pay the most. “Drivers under 20 tend to have the highest car insurance rates to begin with, mostly because this age group has higher crash rates than older drivers,” he says. “When you’re already paying a higher rate, the same percentage increase translates into a bigger dollar jump than it would for someone with a lower base rate.”
Percentage increases are relatively similar across the age groups analyzed, ranging from 27.4% for 30-year-olds to 31.4% for 70-year-olds.
Change in auto insurance premiums after speeding ticket by age
| Age | Avg. annual premium before | Avg. annual premium after | % difference | $ difference |
|---|---|---|---|---|
| 20 | $4,157.00 | $5,342.00 | 28.5% | $1,185.00 |
| 30 | $2,155.00 | $2,745.92 | 27.4% | $590.92 |
| 40 | $2,011.58 | $2,582.00 | 28.4% | $570.42 |
| 50 | $1,898.67 | $2,455.83 | 29.3% | $557.16 |
| 60 | $1,824.75 | $2,375.25 | 30.2% | $550.50 |
| 70 | $2,059.92 | $2,706.58 | 31.4% | $646.66 |
| 80 | $2,663.92 | $3,485.17 | 30.8% | $821.25 |
Keeping insurance costs down after a speeding ticket: Expert tips
A speeding ticket can lead to higher car insurance premiums, but drivers can take steps to limit the financial impact. Bhatt recommends the following:
- Look into a defensive driving course. “Some states allow drivers to take a safe driving class to keep a speeding ticket off their record,” Bhatt says. “If you’re eligible, the time and cost of completing a course may be worth it to avoid a potential insurance rate increase.”
- Shop around for insurance. “A speeding ticket typically won’t affect your insurance premium until your next renewal,” he says. “If your rate goes up, compare quotes from multiple insurers. Some companies penalize speeding violations less heavily than others, so switching could save you money.”
- Avoid additional violations. “Pay close attention to posted speed limits, traffic signs and your surroundings whenever you’re behind the wheel,” he says. “Preventing another ticket can help you avoid further rate increases and maintain a safer driving record.”
Methodology
LendingTree analyzed insurance rate data from Quadrant Information Services for September 2026, based on publicly available insurance company filings. Rates reflect an analysis of hundreds of thousands of car insurance quotes for a typical driver and are intended for comparative purposes only. Actual rates may vary based on factors such as location, driving history, age, credit profile and insurer.
Unless otherwise noted, quotes represent a full coverage policy for a 30-year-old man with good credit and a clean driving record who drives a 2018 Honda CR-V EX.
To measure the impact of a speeding ticket on insurance premiums, we compared rates before and after a driver’s first ticket for driving 11 to 15 mph over the posted speed limit. The 11 to 15 mph range was selected based on findings from national and statewide analyses, including the Washington State Driving Behavior Analysis (2024), a 2021 study on speeding behavior and risk factors published in the Journal of Safety Research, and research from the National Highway Traffic Safety Administration (NHTSA). These sources examine speeding behavior, including driving 10 mph or more over the posted limit.
We used the same methodology to analyze how the impact of a speeding ticket varies by driver age.
Minimum liability policies include only the state-required minimum coverage limits.
Full coverage policies include collision, comprehensive and liability coverage with the following limits and deductibles:
- Bodily injury liability: $50,000 per person and $100,000 per accident
- Property damage liability: $50,000
- Uninsured and underinsured motorist bodily injury: $50,000 per person and $100,000 per accident
- Personal injury protection: Minimum limits, where required by law
- Collision: $500 deductible
- Comprehensive: $500 deductible