Raleigh, N.C., Has the Highest Accident Rate Among Major US Cities


Where you live might say a lot about your odds of being involved in an accident. An analysis of QuoteWizard by LendingTree insurance quote data found that accident rates vary wildly from one U.S. city to the next, with drivers in some cities facing nearly twice the national average risk.
Here’s a look at which cities are most accident-prone and how to ensure you’re prepared for an accident with your car insurance.
- Raleigh, N.C., has the highest accident rate among the 50 largest U.S. cities, at 29.1 accidents per 1,000 drivers. That’s 11.2 more accidents per 1,000 drivers than the U.S. rate of 17.9.
- California cities occupy six of the top 10 spots. San Diego (28.2 per 1,000 drivers) ranks second, while Los Angeles and San Francisco tie for third at 26.9. Sacramento (25.6) ranks sixth, Long Beach (22.7) eighth and San Jose (22.3) ninth.
- Gen Zers have the highest accident rate by generation, at 33.1 per 1,000 drivers. That’s more than twice the rates for millennials and Gen Xers, at 14.8 and 14.9, respectively.
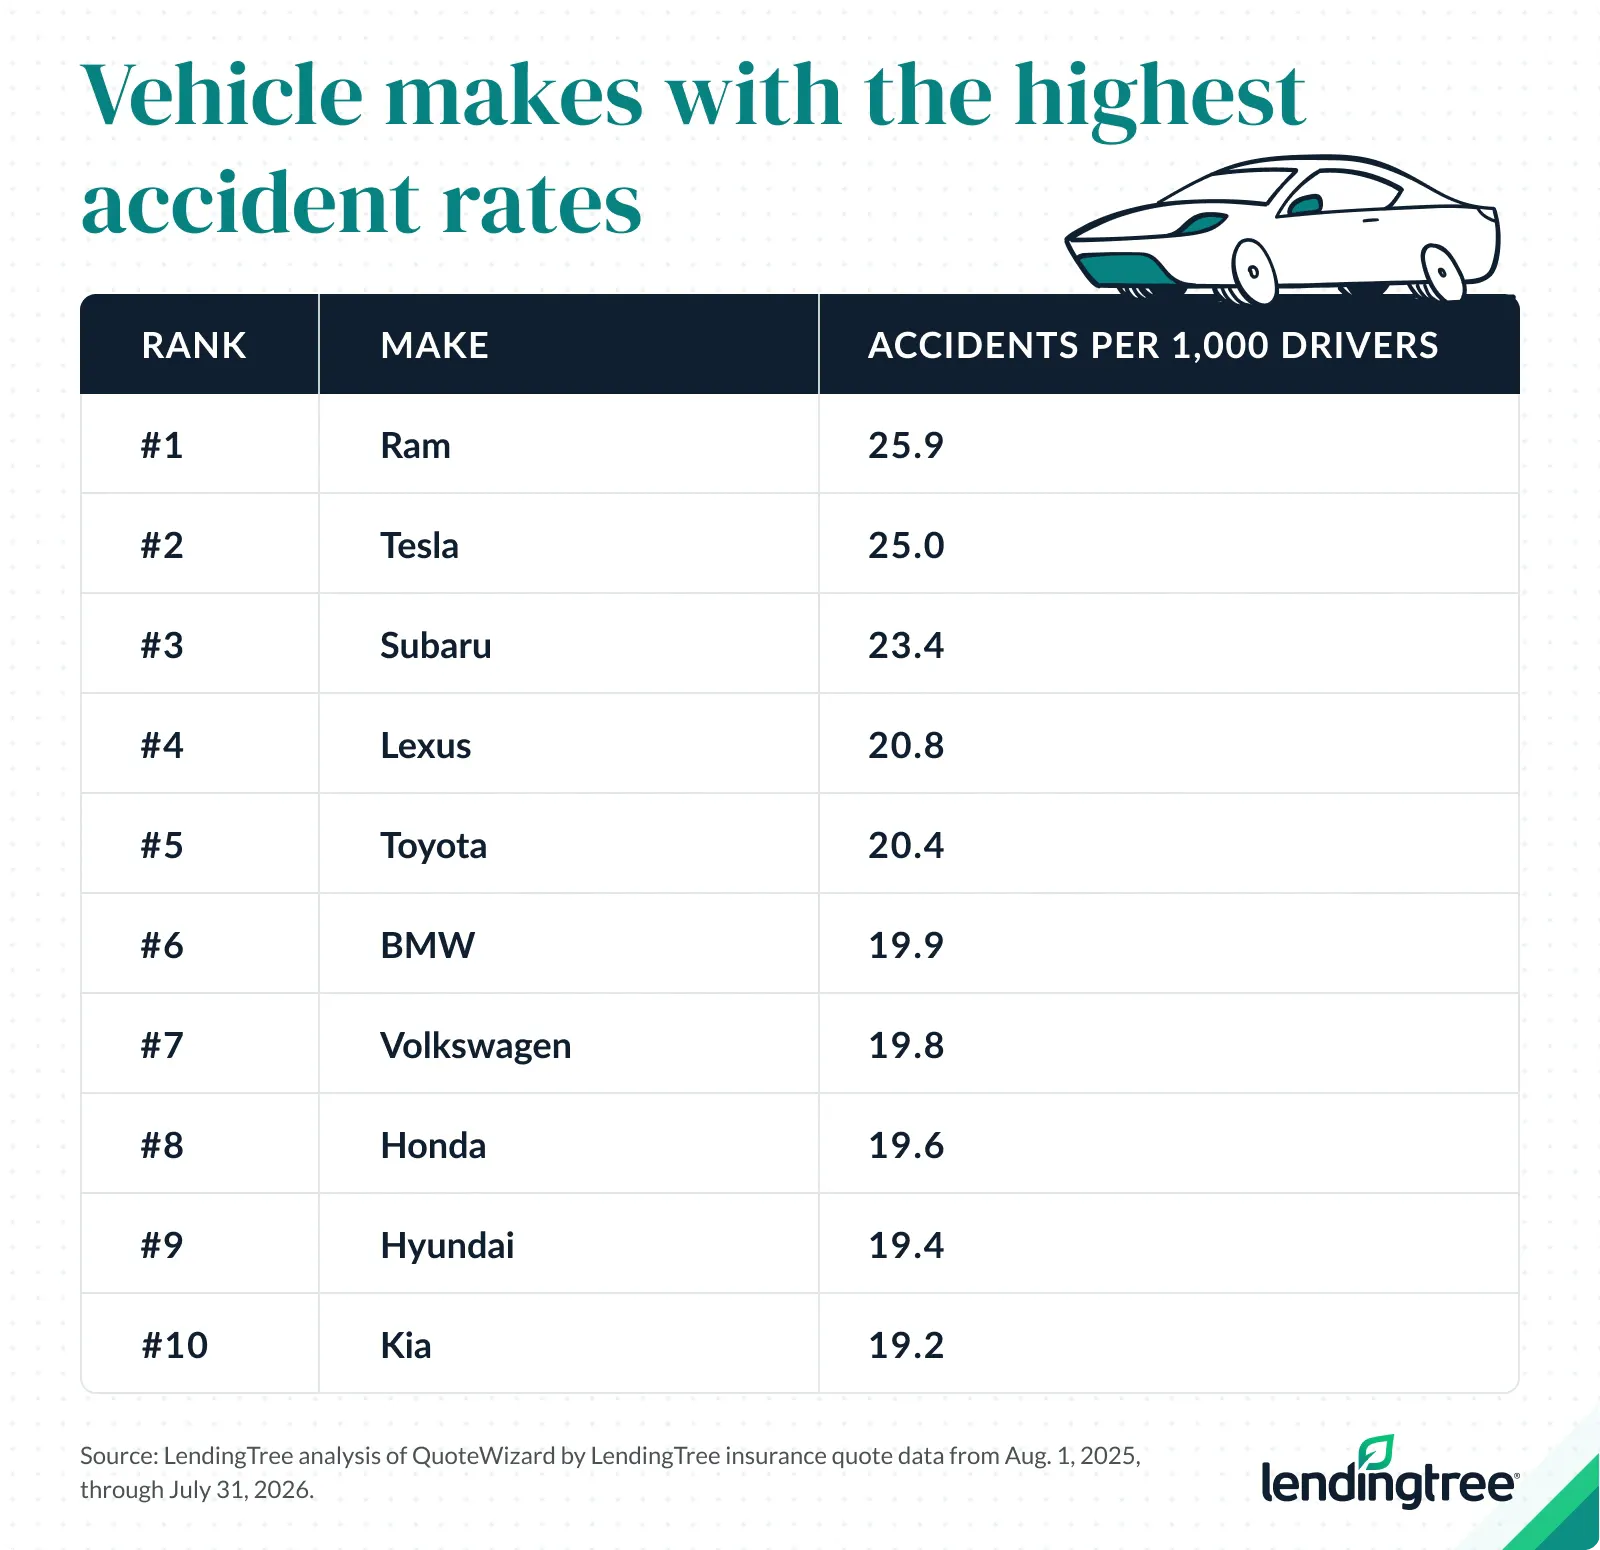
- Ram drivers have the highest accident rate by vehicle make, at 25.9 per 1,000 drivers. Tesla (25.0) and Subaru (23.4) follow, while Pontiac has the lowest rate among the 30 vehicle makes analyzed, at 9.0.
- Memphis, Tenn., had the highest fatal crash rate in 2024, at 27.7 per 100,000 residents. That’s more than 2.5 times the U.S. rate of 10.7. Tucson, Ariz., ranked second at 24.0, followed by Albuquerque, N.M., at 19.1.
- Washington, D.C., had the largest percentage increase in fatal crashes from 2019 to 2024. Fatal crashes rose 109.1% from 22 to 46. Conversely, Atlanta had the largest percentage decrease, with fatal crashes falling 32.1% from 81 to 55.
Raleigh, N.C., has the highest accident risk in the country
Raleigh, N.C., tops the list of large U.S. cities for accident rates, with 29.1 accidents per 1,000 drivers — well above the national average of 17.9.
No single factor explains why accident rates differ so much from city to city, but according to LendingTree auto insurance expert Lindsay Bishop, the differences typically reflect a mix of how much people drive, traffic volume, speed limits, road maintenance and driver behavior.
“Generally, the more time drivers spend on the road and the more traffic congestion, the more opportunities there are for accidents,” she says. “Raleigh’s high accident rate is probably a combination of rapid growth, lots of driving and a road network where high traffic volumes and higher speeds can create more opportunities for crashes.”
Most fatal accidents in Raleigh take place on roads maintained by the North Carolina Department of Transportation (NCDOT), which tend to have higher speed limits and more traffic than city-maintained roads. The city’s recent traffic safety analysis also found that speeding was involved in more than half of fatal crashes.
California cities fill 6 of the top 10 spots
California cities claim six of the top 10 spots for accident rates. San Diego ranks second at 28.2 per 1,000 drivers, Los Angeles and San Francisco tie for third at 26.9, Sacramento comes in sixth at 25.6, Long Beach is eighth at 22.7 and San Jose is ninth at 22.3.
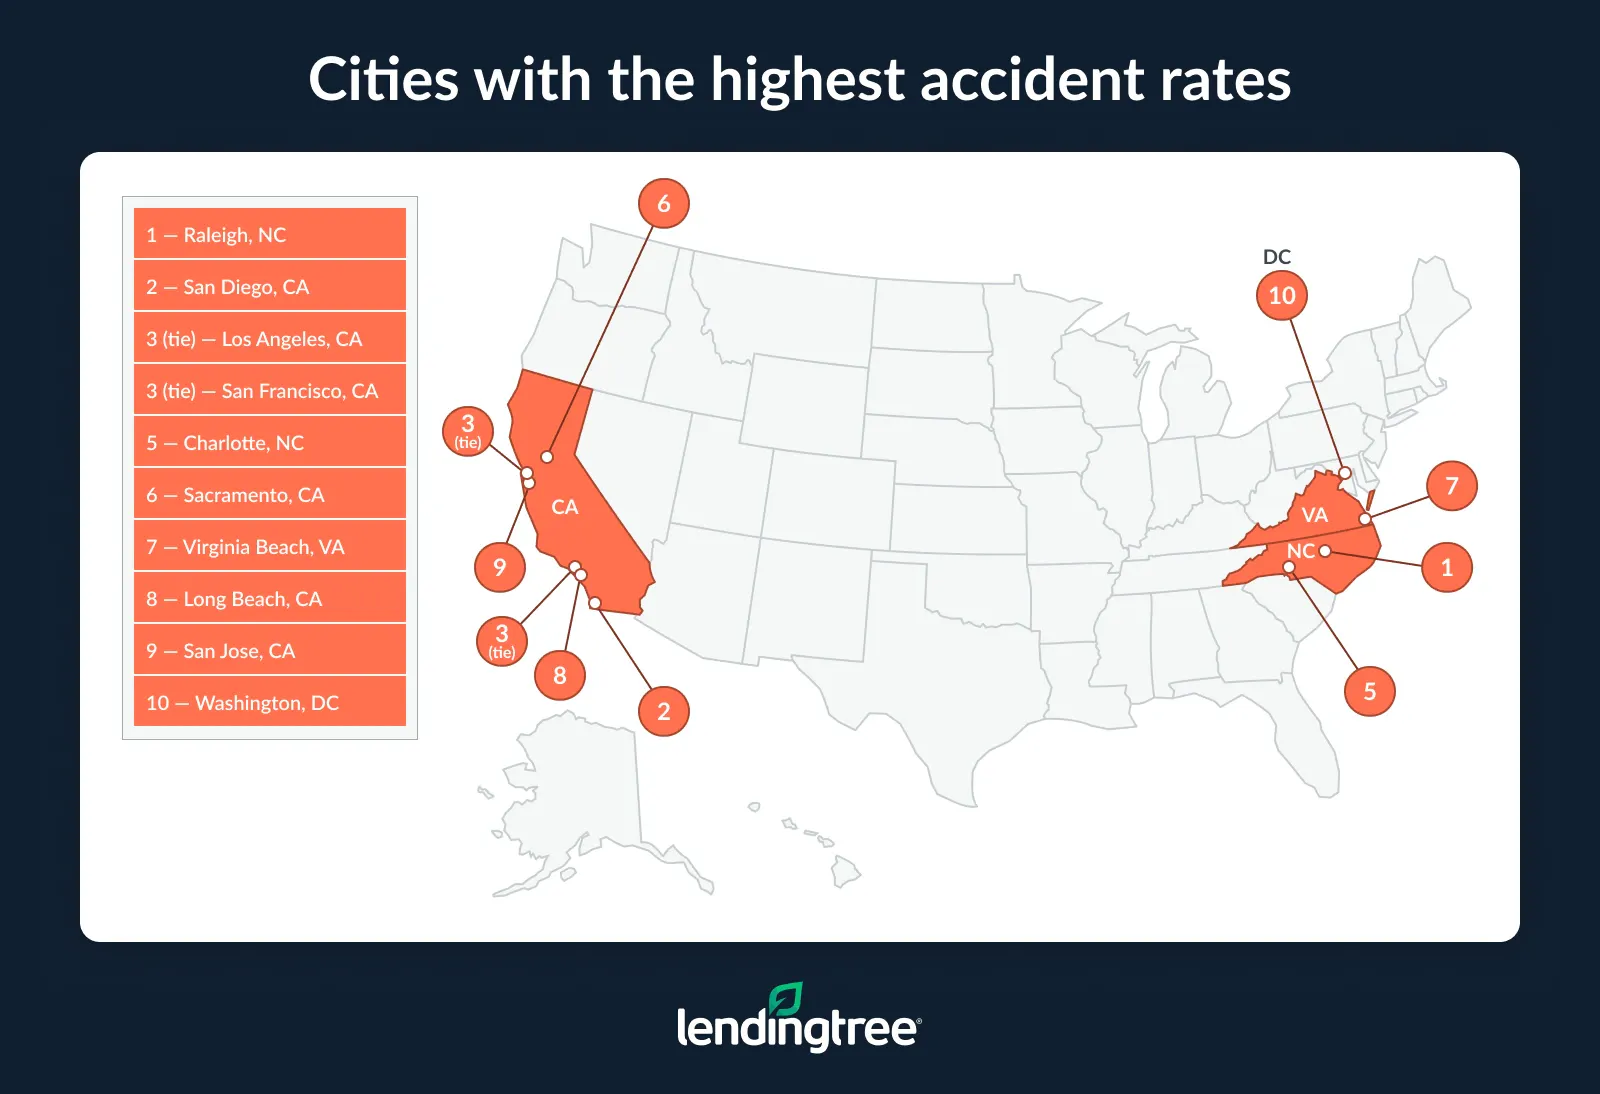
Bishop attributes this trend partly to how much time California drivers spend in traffic. “Drivers living in major California cities tend to spend a lot of time in heavy traffic,” she says. “That means more interactions between vehicles, whether that’s merging onto a freeway, changing lanes or navigating busy intersections. And every additional interaction creates another opportunity for an accident.”
Full rankings: Cities with the highest/lowest accident rates
| Rank | City | Accidents per 1,000 drivers |
|---|---|---|
| 1 | Raleigh, NC | 29.1 |
| 2 | San Diego, CA | 28.2 |
| 3 | Los Angeles, CA | 26.9 |
| 3 | San Francisco, CA | 26.9 |
| 5 | Charlotte, NC | 26.2 |
| 6 | Sacramento, CA | 25.6 |
| 7 | Virginia Beach, VA | 23.9 |
| 8 | Long Beach, CA | 22.7 |
| 9 | San Jose, CA | 22.3 |
| 10 | Washington, DC | 22.1 |
| 11 | Bakersfield, CA | 20.9 |
| 11 | Indianapolis, IN | 20.9 |
| 13 | Fresno, CA | 20.4 |
| 14 | Louisville, KY | 19.8 |
| 15 | Oakland, CA | 19.6 |
| 16 | Las Vegas, NV | 19.4 |
| 17 | Columbus, OH | 19.1 |
| 18 | San Antonio, TX | 18.4 |
| 19 | Austin, TX | 17.7 |
| 20 | Omaha, NE | 17.6 |
| 21 | Seattle, WA | 17.5 |
| 22 | Portland, OR | 17.0 |
| 23 | Fort Worth, TX | 16.8 |
| 24 | Baltimore, MD | 16.7 |
| 25 | El Paso, TX | 16.6 |
| 25 | Boston, MA | 16.6 |
| 27 | Nashville, TN | 15.6 |
| 28 | Colorado Springs, CO | 15.5 |
| 29 | New York, NY | 15.4 |
| 29 | Albuquerque, NM | 15.4 |
| 31 | Atlanta, GA | 15.1 |
| 32 | Milwaukee, WI | 14.8 |
| 32 | Minneapolis, MN | 14.8 |
| 34 | Philadelphia, PA | 14.6 |
| 35 | Houston, TX | 14.4 |
| 36 | Jacksonville, FL | 14.1 |
| 37 | Tucson, AZ | 13.9 |
| 38 | Kansas City, MO | 13.8 |
| 39 | Oklahoma City, OK | 13.5 |
| 40 | Tampa, FL | 12.8 |
| 41 | Tulsa, OK | 12.6 |
| 41 | Phoenix, AZ | 12.6 |
| 43 | Dallas, TX | 12.5 |
| 44 | Mesa, AZ | 12.3 |
| 45 | Aurora, CO | 12.2 |
| 46 | Denver, CO | 11.6 |
| 47 | Chicago, IL | 10.7 |
| 47 | Memphis, TN | 10.7 |
| 49 | Miami, FL | 10.5 |
| 50 | Detroit, MI | 6.8 |
Gen Z drivers crash at more than double the rate of older generations
Gen Zers ages 18 to 28 have the highest accident rate of any generation, at 33.1 per 1,000 drivers — more than twice the rates for millennials ages 29 to 44 (14.8) and Gen Xers ages 45 to 60 (14.9). Baby boomers ages 61 to 79 have the second-highest accident rate, at 18.0.
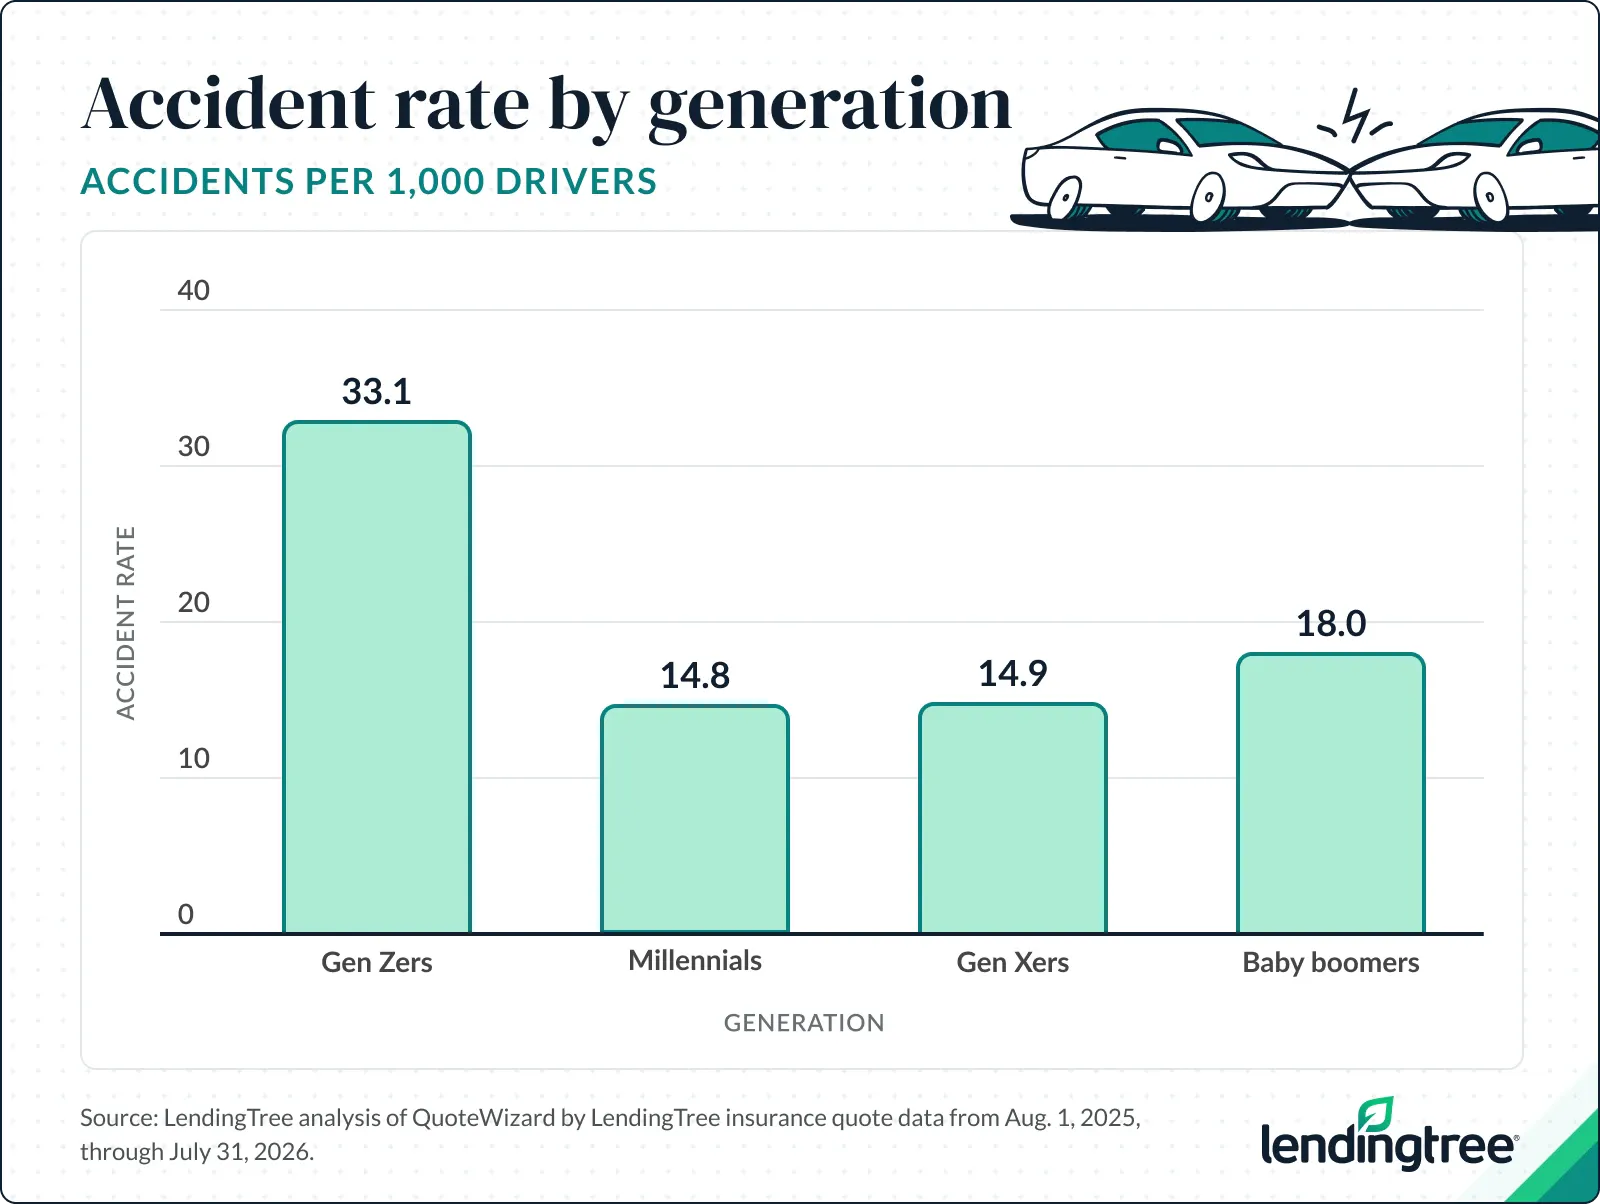
Bishop says the gap largely comes down to driving experience. “Newer drivers haven’t had as much time behind the wheel, so it’s harder to recognize dangerous situations and react to them quickly,” she says. “Younger drivers are also more likely to engage in risky behaviors like speeding.”
That may translate into higher insurance costs. “Insurance companies set rates based on the likelihood you’ll get into an accident and file a claim,” she says. “Since younger drivers with less experience statistically cause more accidents, this makes them more expensive to insure.”
Ram, Tesla and Subaru drivers get into the most accidents
By vehicle brand, Ram drivers have the highest accident rate at 25.9 per 1,000 drivers, followed by Tesla (25.0) and Subaru (23.4).
Related: Best and worst drivers by brand
Bishop cautions against reading too much into brand-level numbers on their own. “Driving a Ram, Tesla or Subaru doesn’t automatically mean you’re more likely to get into an accident,” she says. “But different vehicles attract different types of drivers, and factors like age, driving experience, how much someone drives and where they drive can all affect their chances of getting into a crash. Vehicle characteristics and safety technology can certainly play a role, but it’s difficult to separate them from the behavior of the people behind the wheel.”
Meanwhile, Pontiac has the lowest rate among the 30 vehicle makes analyzed, at 9.0 — the only brand below 10.0. Chrysler (11.4) and Cadillac (12.1) follow.
Full rankings: Vehicle makes with the highest/lowest accident rates
| Rank | Make | Accidents per 1,000 drivers |
|---|---|---|
| 1 | Ram | 25.9 |
| 2 | Tesla | 25.0 |
| 3 | Subaru | 23.4 |
| 4 | Lexus | 20.8 |
| 5 | Toyota | 20.4 |
| 6 | BMW | 19.9 |
| 7 | Volkswagen | 19.8 |
| 8 | Honda | 19.6 |
| 9 | Hyundai | 19.4 |
| 10 | Kia | 19.2 |
| 11 | Volvo | 19.1 |
| 12 | Jeep | 19.0 |
| 12 | Infiniti | 19.0 |
| 14 | Audi | 18.9 |
| 15 | Mazda | 18.8 |
| 16 | Nissan | 18.7 |
| 17 | Mercedes-Benz | 17.5 |
| 18 | Mitsubishi | 17.4 |
| 19 | Ford | 17.1 |
| 20 | Chevrolet | 16.8 |
| 21 | GMC | 16.5 |
| 22 | Lincoln | 16.4 |
| 23 | Acura | 15.7 |
| 24 | Land Rover | 15.2 |
| 25 | Buick | 14.9 |
| 26 | Mercury | 14.1 |
| 27 | Dodge | 13.6 |
| 28 | Cadillac | 12.1 |
| 29 | Chrysler | 11.4 |
| 30 | Pontiac | 9.0 |
Memphis, Tenn., has the highest fatal crash rate in the U.S., while Washington, D.C., saw the largest increase
Memphis, Tenn., had the highest fatal crash rate of any large U.S. city in 2024, at 27.7 per 100,000 residents — more than 2.5 times the U.S. rate of 10.7. Tucson, Ariz., ranked second at 24.0, while Albuquerque, N.M., ranked third at 19.1.
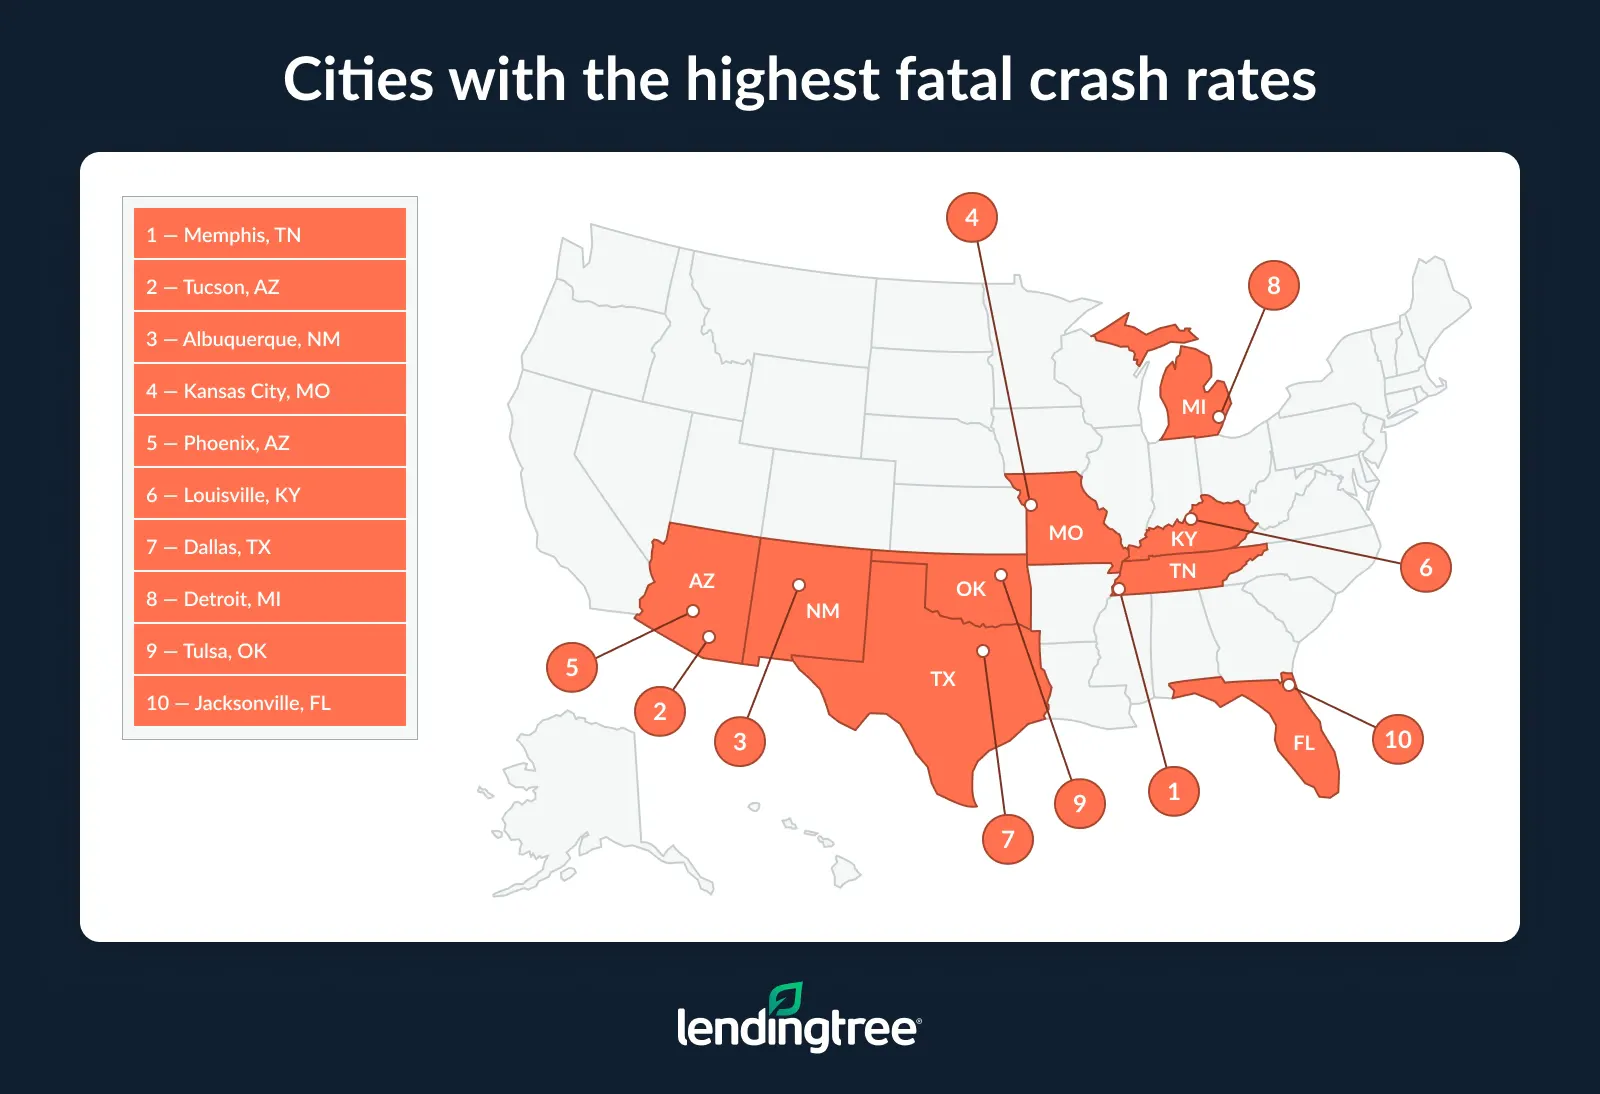
Bishop says speed is the biggest driver of differences in fatal crash rates among cities, even when their overall accident numbers aren’t unusually high.
“A car driving 80 mph on a highway has a much greater chance of causing a serious injury than one on a residential street driving 25 mph,” she says. “Road design matters, too. Wide, high-speed roads with lots of intersections can be dangerous, especially when pedestrians and cyclists are sharing those roads. Even what happens after an accident can make a difference. Ambulance response times and access to nearby trauma centers can affect the outcome of a serious crash.”
Washington, D.C., saw the largest percentage increase in fatal crashes from 2019 to 2024. Fatal crashes climbed 109.1%, from 22 to 46 — the only city where the number more than doubled. Tucson, Ariz. (70.5%), and Las Vegas (66.7%) followed.
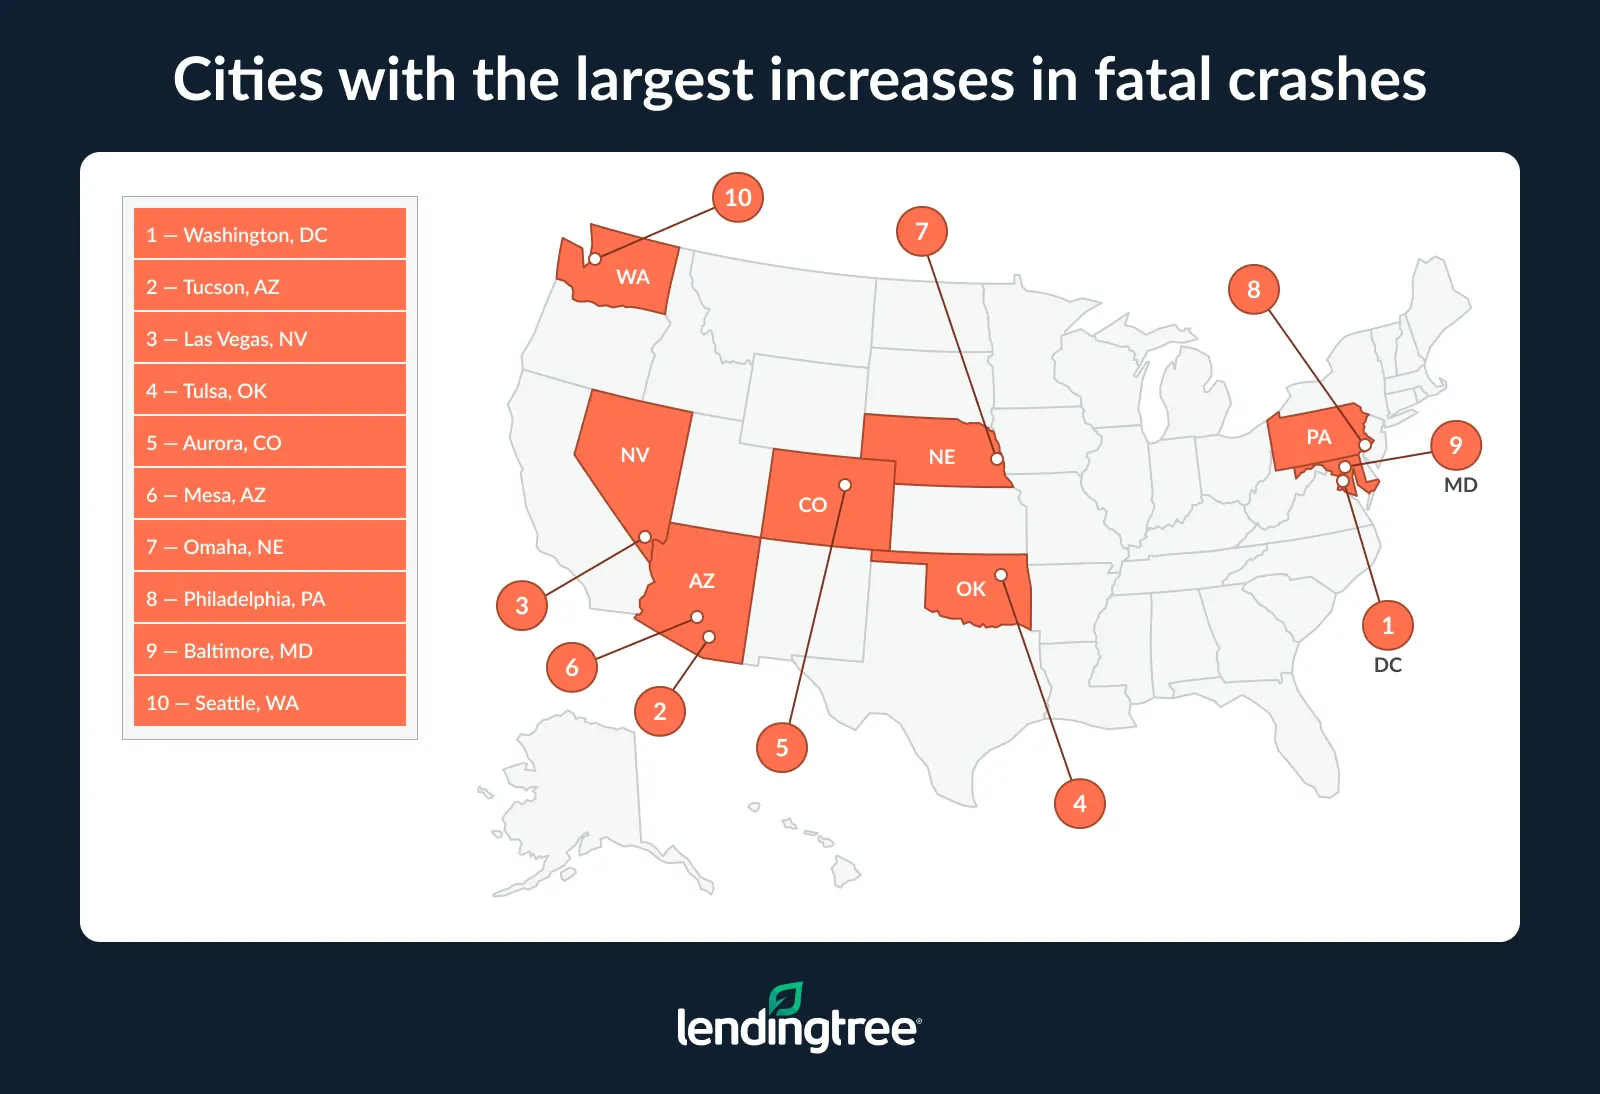
Meanwhile, eight cities saw a decrease in fatal crashes, with Atlanta recording the largest percentage drop. Fatal crashes there fell 32.1% from 81 to 55. San Jose, Calif. (31.2%), and Tampa, Fla. (9.8%), followed.
Full rankings: Cities with the highest/lowest fatal crash rates
| Rank | City | Fatal crashes | Fatal crashes per 100,000 residents |
|---|---|---|---|
| 1 | Memphis, TN | 169 | 27.7 |
| 2 | Tucson, AZ | 133 | 24.0 |
| 3 | Albuquerque, NM | 107 | 19.1 |
| 4 | Kansas City, MO | 84 | 16.3 |
| 5 | Phoenix, AZ | 267 | 16.0 |
| 6 | Louisville, KY | 102 | 15.9 |
| 7 | Dallas, TX | 206 | 15.5 |
| 8 | Detroit, MI | 99 | 15.3 |
| 9 | Tulsa, OK | 59 | 14.2 |
| 10 | Jacksonville, FL | 142 | 14.1 |
| 11 | Houston, TX | 331 | 13.8 |
| 12 | Nashville, TN | 95 | 13.5 |
| 13 | Tampa, FL | 55 | 13.3 |
| 14 | Miami, FL | 63 | 12.9 |
| 15 | Oklahoma City, OK | 91 | 12.8 |
| 16 | Indianapolis, IN | 107 | 12.0 |
| 17 | Milwaukee, WI | 64 | 11.4 |
| 18 | Charlotte, NC | 107 | 11.3 |
| 18 | San Antonio, TX | 172 | 11.3 |
| 20 | Aurora, CO | 45 | 11.2 |
| 20 | Mesa, AZ | 58 | 11.2 |
| 22 | Atlanta, GA | 55 | 10.6 |
| 23 | Bakersfield, CA | 43 | 10.3 |
| 24 | Omaha, NE | 50 | 10.2 |
| 24 | Fresno, CA | 56 | 10.2 |
| 26 | Fort Worth, TX | 102 | 10.1 |
| 27 | Baltimore, MD | 57 | 10.0 |
| 28 | El Paso, TX | 67 | 9.8 |
| 29 | Austin, TX | 93 | 9.4 |
| 30 | Sacramento, CA | 49 | 9.1 |
| 31 | Colorado Springs, CO | 44 | 8.9 |
| 32 | Denver, CO | 62 | 8.5 |
| 33 | Philadelphia, PA | 132 | 8.4 |
| 34 | Portland, OR | 53 | 8.3 |
| 35 | Las Vegas, NV | 55 | 8.1 |
| 35 | Oakland, CA | 36 | 8.1 |
| 37 | Long Beach, CA | 36 | 8.0 |
| 38 | Los Angeles, CA | 295 | 7.6 |
| 39 | San Diego, CA | 102 | 7.3 |
| 40 | Washington, DC | 46 | 6.6 |
| 41 | Columbus, OH | 61 | 6.5 |
| 42 | Raleigh, NC | 32 | 6.4 |
| 43 | Chicago, IL | 156 | 5.7 |
| 44 | San Jose, CA | 53 | 5.3 |
| 45 | Seattle, WA | 40 | 5.1 |
| 45 | Virginia Beach, VA | 23 | 5.1 |
| 47 | San Francisco, CA | 41 | 5.0 |
| 48 | Minneapolis, MN | 17 | 4.0 |
| 49 | Boston, MA | 25 | 3.7 |
| 50 | New York, NY | 34 | 0.4 |
Full rankings: Cities with the largest/smallest percentage changes in fatal crashes
| Rank | City | Fatal crashes, 2019 | Fatal crashes, 2024 | % change |
|---|---|---|---|---|
| 1 | Washington, DC | 22 | 46 | 109.1% |
| 2 | Tucson, AZ | 78 | 133 | 70.5% |
| 3 | Las Vegas, NV | 33 | 55 | 66.7% |
| 4 | Tulsa, OK | 36 | 59 | 63.9% |
| 5 | Aurora, CO | 28 | 45 | 60.7% |
| 6 | Mesa, AZ | 37 | 58 | 56.8% |
| 7 | Omaha, NE | 32 | 50 | 56.3% |
| 8 | Philadelphia, PA | 85 | 132 | 55.3% |
| 9 | Baltimore, MD | 37 | 57 | 54.1% |
| 10 | Seattle, WA | 27 | 40 | 48.1% |
| 11 | Minneapolis, MN | 12 | 17 | 41.7% |
| 12 | Charlotte, NC | 76 | 107 | 40.8% |
| 13 | Phoenix, AZ | 191 | 267 | 39.8% |
| 14 | Houston, TX | 243 | 331 | 36.2% |
| 15 | Memphis, TN | 125 | 169 | 35.2% |
| 16 | Milwaukee, WI | 48 | 64 | 33.3% |
| 17 | Boston, MA | 19 | 25 | 31.6% |
| 18 | Fresno, CA | 44 | 56 | 27.3% |
| 19 | Bakersfield, CA | 35 | 43 | 22.9% |
| 19 | Fort Worth, TX | 83 | 102 | 22.9% |
| 21 | Dallas, TX | 170 | 206 | 21.2% |
| 22 | Virginia Beach, VA | 19 | 23 | 21.1% |
| 23 | San Francisco, CA | 34 | 41 | 20.6% |
| 24 | Oakland, CA | 30 | 36 | 20.0% |
| 24 | San Diego, CA | 85 | 102 | 20.0% |
| 26 | Oklahoma City, OK | 76 | 91 | 19.7% |
| 27 | Louisville, KY | 87 | 102 | 17.2% |
| 28 | Chicago, IL | 135 | 156 | 15.6% |
| 29 | Portland, OR | 46 | 53 | 15.2% |
| 30 | San Antonio, TX | 150 | 172 | 14.7% |
| 31 | Sacramento, CA | 43 | 49 | 14.0% |
| 32 | Colorado Springs, CO | 39 | 44 | 12.8% |
| 33 | Kansas City, MO | 75 | 84 | 12.0% |
| 34 | Los Angeles, CA | 264 | 295 | 11.7% |
| 35 | Miami, FL | 57 | 63 | 10.5% |
| 36 | Albuquerque, NM | 97 | 107 | 10.3% |
| 37 | Indianapolis, IN | 98 | 107 | 9.2% |
| 38 | Denver, CO | 57 | 62 | 8.8% |
| 39 | Austin, TX | 89 | 93 | 4.5% |
| 40 | Nashville, TN | 93 | 95 | 2.2% |
| 41 | El Paso, TX | 67 | 67 | 0.0% |
| 41 | Long Beach, CA | 36 | 36 | 0.0% |
| 43 | Jacksonville, FL | 145 | 142 | -2.1% |
| 44 | Detroit, MI | 104 | 99 | -4.8% |
| 45 | Raleigh, NC | 34 | 32 | -5.9% |
| 46 | Columbus, OH | 66 | 61 | -7.6% |
| 47 | New York, NY | 37 | 34 | -8.1% |
| 48 | Tampa, FL | 61 | 55 | -9.8% |
| 49 | San Jose, CA | 77 | 53 | -31.2% |
| 50 | Atlanta, GA | 81 | 55 | -32.1% |
Taking control of your driving risk: Top expert tips
You may not be able to change the risks on the roads around you, but you can make choices that reduce your exposure to them. A few adjustments to when and how you drive could help keep you safer — and may even lower your insurance costs:
- Choose safer times and habits. “If your schedule allows, avoid late-night driving and rush hour traffic,” Bishop says. “Whenever you’re behind the wheel, slow down, leave plenty of following distance and stay focused so you have more time to react to other drivers.”
- Consider a safe driving insurance program. “Usage-based insurance programs track habits such as your speed and when you drive,” she says. “Demonstrating safe driving habits could qualify you for a significant discount on your car insurance.”
- Compare your insurance options. Even with a safe driving discount, shop around and compare quotes periodically. Insurers weigh risk differently, so another company may offer a lower rate for the same coverage.
Methodology
LendingTree researchers analyzed QuoteWizard by LendingTree insurance quote data from Aug. 1, 2025, through July 31, 2026, to calculate accidents per 1,000 drivers. City rankings cover the 50 largest U.S. cities. Researchers also calculated accident rates by generation and for the 30 vehicle makes with the most inquiries.
Researchers analyzed National Highway Traffic Safety Administration (NHTSA) Fatality Analysis Reporting System (FARS) data to calculate fatal crashes per 100,000 residents in 2024. Researchers divided each city’s fatal crash count by its 2024 population and multiplied the result by 100,000.
To measure changes over time, researchers compared fatal crash counts in 2019 and 2024 and calculated the percentage change between the two.