Best and Worst Drivers by State: 2026 Report


Driving is easily one of the most dangerous tasks in our daily lives. And our own good driving is only half of the equation when it comes to staying safe on the road — the driving habits of those around us also play a pivotal role.
Some states have better drivers than others. According to LendingTree research, New Jersey has the worst drivers in the U.S., while Michigan has the best. Read on for more on our findings, plus tips on utilizing auto insurance to protect yourself against bad drivers, no matter which state you live in.
- New Jersey has the worst drivers in the U.S. Through August 2026, New Jersey drivers had 56.9 incidents (accidents, DUIs, speeding-related incidents and general citations) per 1,000 drivers. North Carolina (48.1) ranks second, while Massachusetts and South Carolina tie for third (both 45.9).
- The best drivers are in Michigan. Michigan had 22.1 driving incidents per 1,000 drivers, followed by Hawaii (23.4) and New Mexico (23.5).
- New Jersey also has the highest accident rate. Its 37.6 accidents per 1,000 drivers put it ahead of Massachusetts (33.5) and North Carolina (30.5). Michigan has the lowest rate at 11.5, followed by Arizona and Colorado (12.7 each).
- Wyoming has the highest DUI rate. Wyoming drivers had 2.4 DUIs per 1,000 drivers, followed by Nebraska (2.2) and North Dakota (2.0). Hawaii has the lowest rate at 0.3, while Mississippi, Illinois, Alabama and Georgia tie for second-lowest at 0.5.
- North Dakota has the highest speeding incident rate. The state had 3.7 speeding incidents per 1,000 drivers, ahead of South Carolina (3.2) and Ohio and Washington (3.0 each). Hawaii, New York, the District of Columbia and Massachusetts tie for the lowest rate at 0.7.
New Jersey has the most driving incidents
New Jersey drivers racked up 56.9 incidents per 1,000 drivers through August 2026, a tally that includes accidents, DUIs, speeding and general citations. North Carolina came next at 48.1, with Massachusetts and South Carolina tied for third at 45.9.
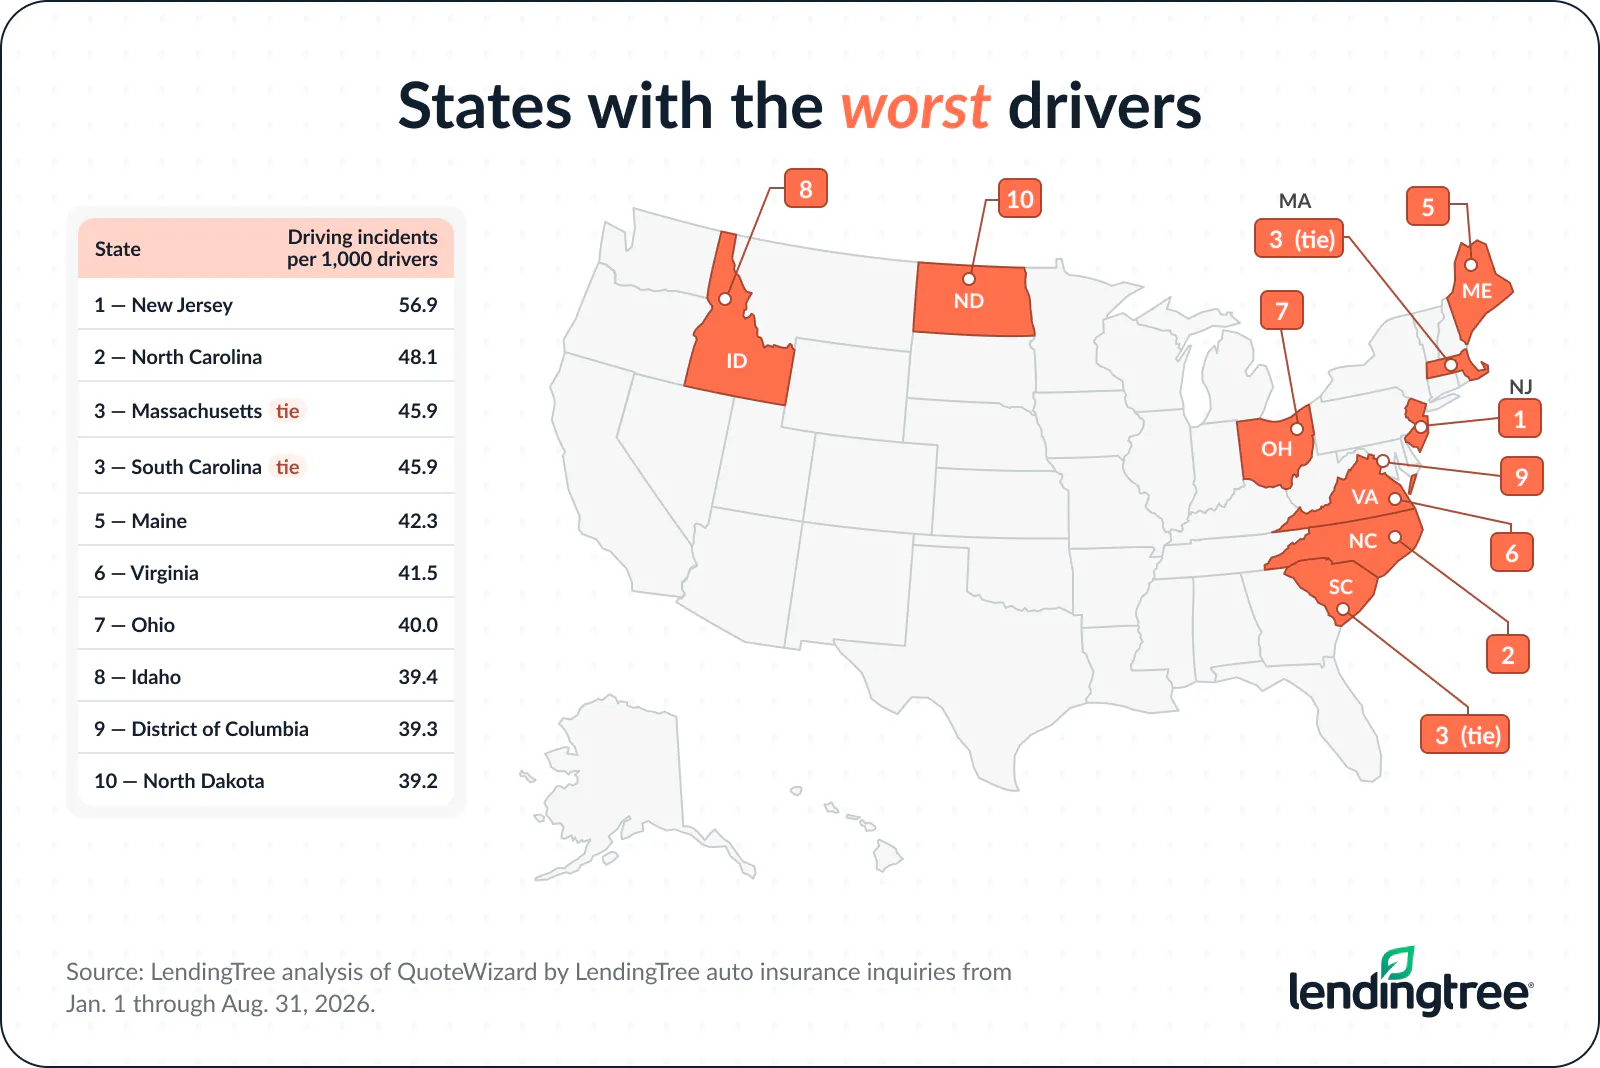
Just how closely do incident rates track with insurance costs? Not perfectly, according to LendingTree auto insurance expert Rob Bhatt.
“New Jersey’s car insurance rates are 18% higher than the national average, but car insurance costs less than the average in the other states,” he says. “An area’s crash rates, in particular, can affect car insurance rates. Car accidents increase insurance companies’ expenses, and these costs get passed along to consumers in the form of higher car insurance rates. That said, there are other factors that also impact an area’s car insurance rates.”
Those other factors include local costs. “Insurance also tends to cost more in states with high costs for medical treatment and/or car repairs, because insurance companies tend to have higher expenses per customer in these areas,” Bhatt says. “Some states require drivers to get more insurance coverage than others, and this can also affect the amount customers pay.”
Michigan drivers have the fewest incidents
Michigan has the safest drivers in the study, with 22.1 incidents per 1,000 drivers. Hawaii (23.4) and New Mexico (23.5) followed close behind.
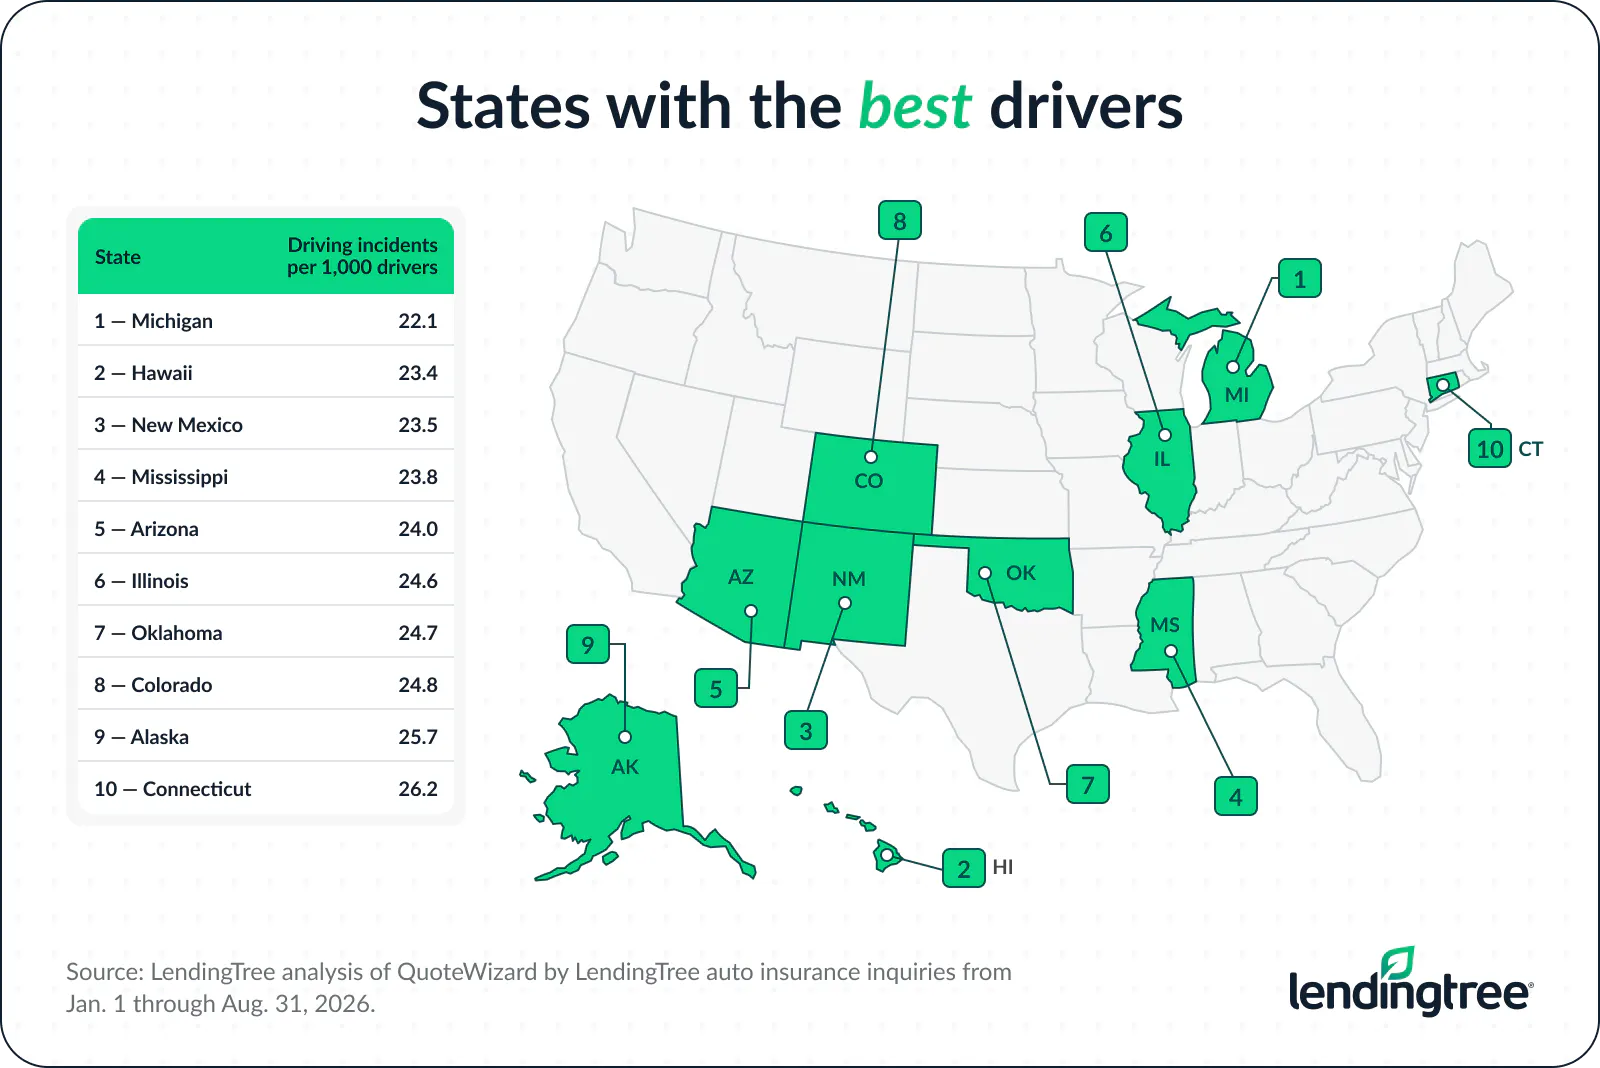
While a good sign, fewer incidents don’t guarantee a cheaper policy.
“It’s tough to draw a definitive conclusion, because car insurance costs less than the national average in Hawaii but more than the average in Michigan,” Bhatt says. “New Mexico’s rates are close to the average. In some states, these other factors offset the impacts of crash rates, sometimes to the benefit of consumers and sometimes not.”
Full rankings: States with the worst/best drivers
| Rank | State | Driving incidents per 1,000 drivers |
|---|---|---|
| 1 | New Jersey | 56.9 |
| 2 | North Carolina | 48.1 |
| 3 | Massachusetts | 45.9 |
| 3 | South Carolina | 45.9 |
| 5 | Maine | 42.3 |
| 6 | Virginia | 41.5 |
| 7 | Ohio | 40.0 |
| 8 | Idaho | 39.4 |
| 9 | District of Columbia | 39.3 |
| 10 | North Dakota | 39.2 |
| 11 | Washington | 38.6 |
| 12 | Rhode Island | 37.5 |
| 13 | Maryland | 37.3 |
| 14 | Kentucky | 36.7 |
| 15 | Iowa | 35.9 |
| 16 | Indiana | 35.4 |
| 17 | New York | 35.1 |
| 18 | West Virginia | 34.4 |
| 18 | Wyoming | 34.4 |
| 20 | Vermont | 33.8 |
| 21 | California | 33.7 |
| 22 | Wisconsin | 33.2 |
| 23 | Georgia | 33.1 |
| 23 | Oregon | 33.1 |
| 25 | Nevada | 32.8 |
| 26 | Utah | 32.1 |
| 27 | Nebraska | 32.0 |
| 28 | New Hampshire | 31.3 |
| 29 | Louisiana | 31.2 |
| 30 | Minnesota | 30.9 |
| 31 | South Dakota | 30.7 |
| 32 | Tennessee | 30.6 |
| 33 | Kansas | 30.2 |
| 34 | Delaware | 29.2 |
| 34 | Pennsylvania | 29.2 |
| 36 | Texas | 29.1 |
| 37 | Alabama | 28.7 |
| 38 | Arkansas | 28.0 |
| 39 | Montana | 27.1 |
| 40 | Missouri | 26.7 |
| 41 | Florida | 26.4 |
| 42 | Connecticut | 26.2 |
| 43 | Alaska | 25.7 |
| 44 | Colorado | 24.8 |
| 45 | Oklahoma | 24.7 |
| 46 | Illinois | 24.6 |
| 47 | Arizona | 24.0 |
| 48 | Mississippi | 23.8 |
| 49 | New Mexico | 23.5 |
| 50 | Hawaii | 23.4 |
| 51 | Michigan | 22.1 |
New Jersey also leads in accidents
New Jersey recorded the highest accident rate, at 37.6 per 1,000 drivers. Massachusetts (33.5) and North Carolina (30.5) rounded out the top three. At the other end, Michigan had the fewest accidents at 11.5 per 1,000 drivers, with Arizona and Colorado tied for second-lowest at 12.7.
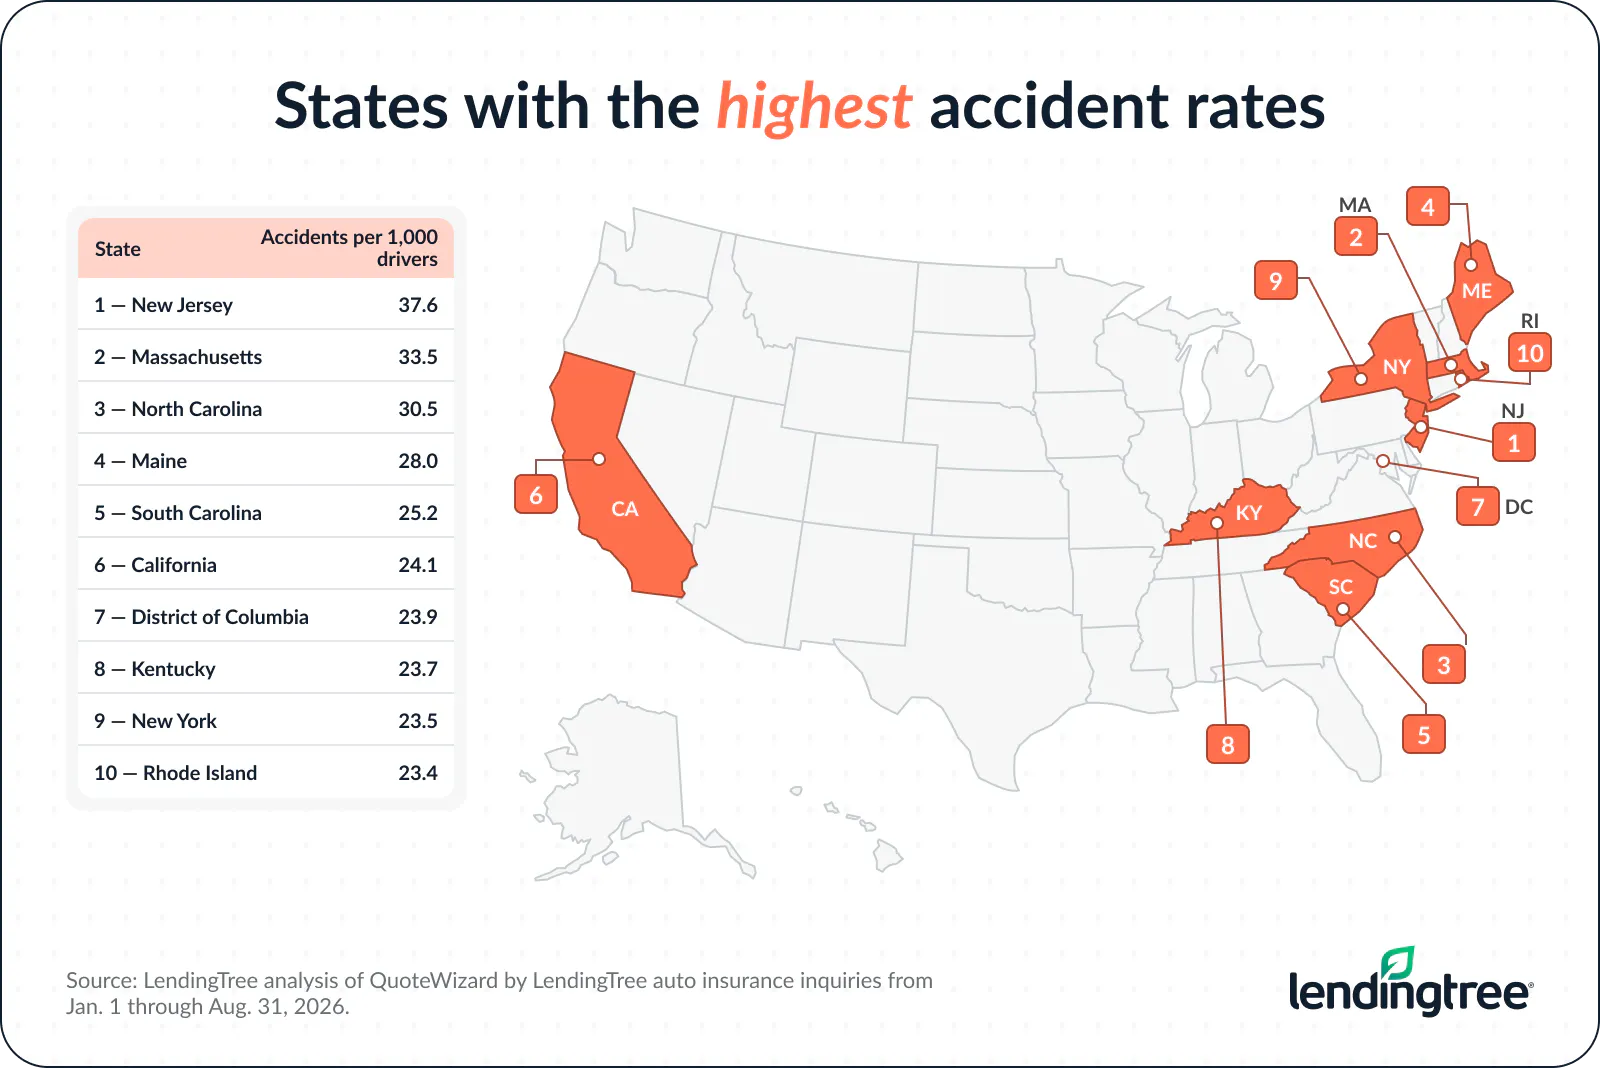
Michigan’s low crash rate doesn’t translate into low premiums, though. “Michigan has slightly higher car insurance rates than New Jersey,” Bhatt says. “This may be due to other factors that offset the benefits of Michigan’s low crash rates.”
One of those factors is that both states have no-fault laws that require personal injury protection, or PIP. “If you’re in an accident, your PIP covers your injuries, regardless of who causes the accident,” Bhatt says. “PIP adds to the cost of car insurance for consumers. Car insurance costs more than the national average in both states.”
Full rankings: States with the highest/lowest accident rates
| Rank | State | Accidents per 1,000 drivers |
|---|---|---|
| 1 | New Jersey | 37.6 |
| 2 | Massachusetts | 33.5 |
| 3 | North Carolina | 30.5 |
| 4 | Maine | 28.0 |
| 5 | South Carolina | 25.2 |
| 6 | California | 24.1 |
| 7 | District of Columbia | 23.9 |
| 8 | Kentucky | 23.7 |
| 9 | New York | 23.5 |
| 10 | Rhode Island | 23.4 |
| 11 | Maryland | 22.9 |
| 12 | Indiana | 22.0 |
| 13 | Virginia | 21.7 |
| 14 | Nevada | 21.5 |
| 15 | Washington | 21.3 |
| 16 | West Virginia | 21.0 |
| 17 | Ohio | 20.8 |
| 18 | Idaho | 20.2 |
| 19 | Vermont | 20.1 |
| 20 | New Hampshire | 19.5 |
| 20 | Louisiana | 19.5 |
| 22 | Texas | 19.3 |
| 23 | Pennsylvania | 18.9 |
| 24 | Connecticut | 18.0 |
| 25 | Nebraska | 17.8 |
| 26 | Georgia | 17.4 |
| 27 | Tennessee | 16.7 |
| 27 | Delaware | 16.7 |
| 29 | Kansas | 16.5 |
| 30 | Wisconsin | 16.4 |
| 31 | Oregon | 16.3 |
| 31 | Alabama | 16.3 |
| 33 | Utah | 16.2 |
| 34 | Iowa | 16.1 |
| 35 | Minnesota | 15.5 |
| 36 | Wyoming | 15.3 |
| 37 | Hawaii | 15.1 |
| 38 | Arkansas | 15.0 |
| 39 | Missouri | 14.8 |
| 40 | North Dakota | 14.5 |
| 41 | South Dakota | 14.4 |
| 41 | Illinois | 14.4 |
| 43 | Florida | 13.9 |
| 44 | Mississippi | 13.6 |
| 45 | Montana | 13.2 |
| 46 | Alaska | 13.1 |
| 47 | Oklahoma | 12.9 |
| 47 | New Mexico | 12.9 |
| 49 | Colorado | 12.7 |
| 49 | Arizona | 12.7 |
| 51 | Michigan | 11.5 |
Wyoming has the highest DUI rate
Wyoming drivers had 2.4 DUIs per 1,000 drivers, the highest in the country. Nebraska (2.2) and North Dakota (2.0) followed. Meanwhile, Hawaii had the lowest rate at 0.3, while Mississippi, Illinois, Alabama and Georgia tied for second-lowest at 0.5.
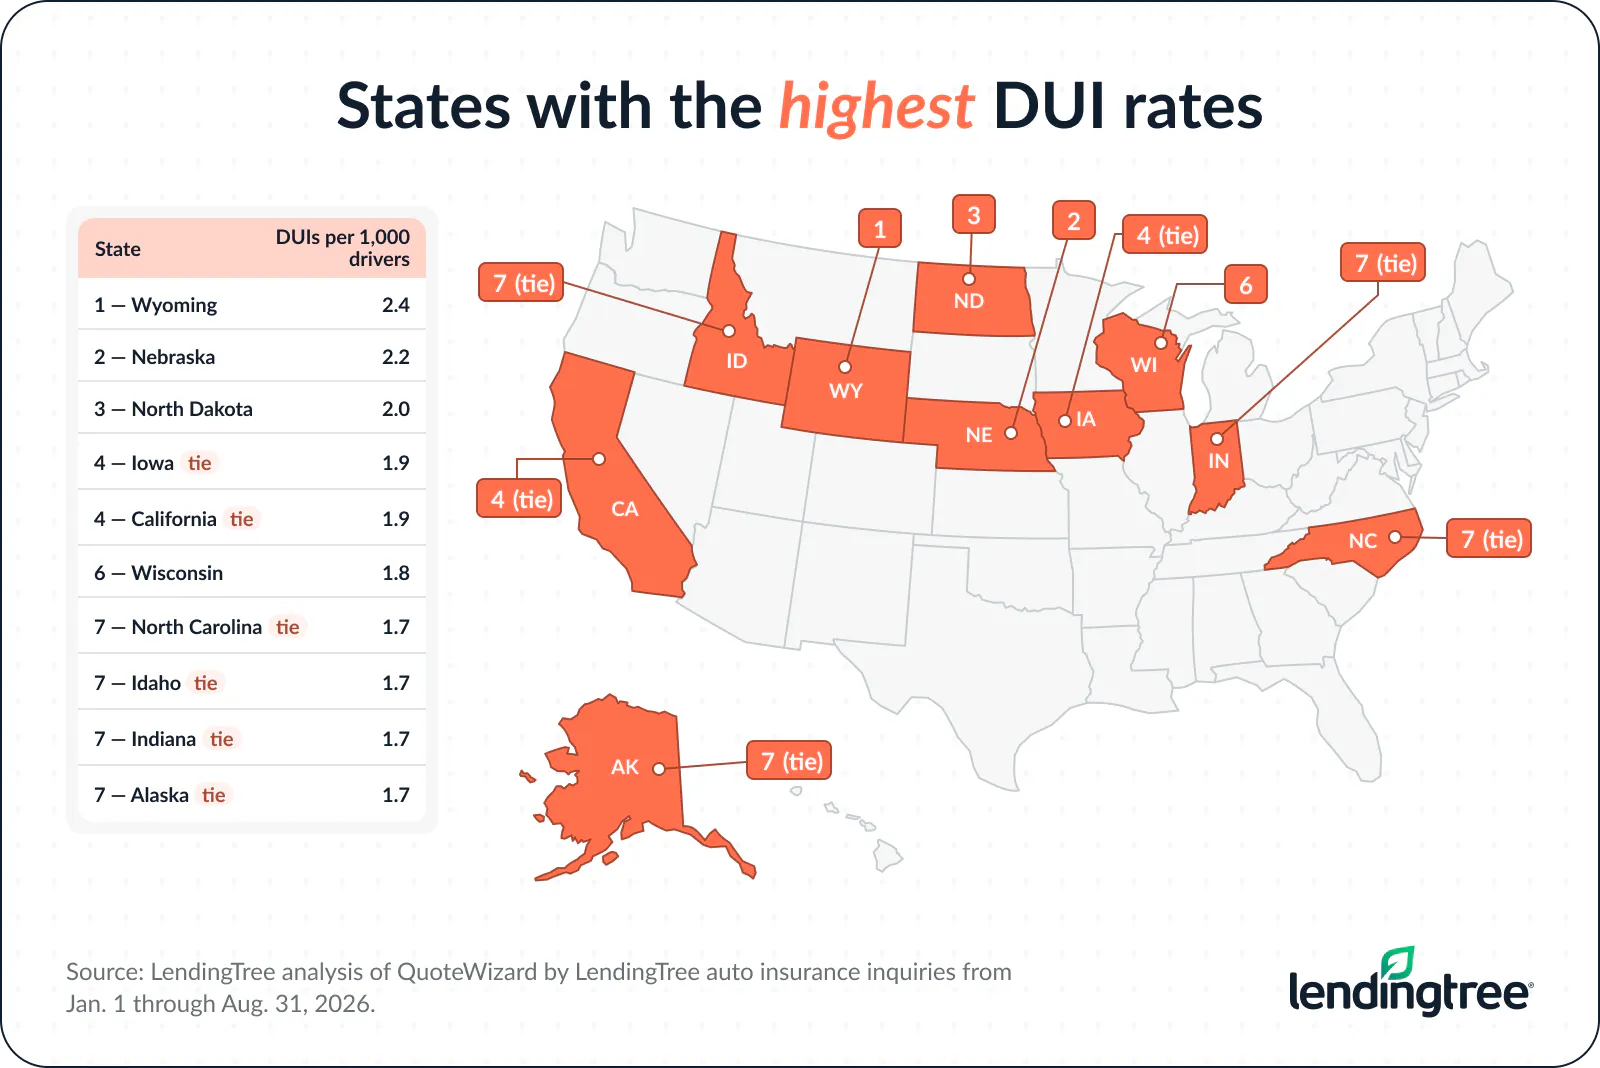
Bhatt says a DUI can be financially punishing for years.
“Our research shows that a DUI raises the average cost of insurance by more than 80%, but some companies won’t insure a driver with a recent DUI,” Bhatt says. “Depending on your situation, you may have to turn to a company that specializes in high-risk drivers for a few years before you start qualifying for more affordable rates again. The effects typically last three to five years, though these look-back periods vary by insurance company and state.”
Related: Auto insurance rates after a DUI study
Full rankings: States with the highest/lowest DUI rates
| Rank | State | DUIs per 1,000 drivers |
|---|---|---|
| 1 | Wyoming | 2.4 |
| 2 | Nebraska | 2.2 |
| 3 | North Dakota | 2.0 |
| 4 | Iowa | 1.9 |
| 4 | California | 1.9 |
| 6 | Wisconsin | 1.8 |
| 7 | North Carolina | 1.7 |
| 7 | Idaho | 1.7 |
| 7 | Indiana | 1.7 |
| 7 | Alaska | 1.7 |
| 11 | Virginia | 1.5 |
| 11 | South Dakota | 1.5 |
| 13 | Minnesota | 1.4 |
| 13 | Montana | 1.4 |
| 15 | New Jersey | 1.3 |
| 15 | Vermont | 1.3 |
| 17 | Kentucky | 1.2 |
| 18 | South Carolina | 1.1 |
| 18 | Ohio | 1.1 |
| 20 | Massachusetts | 1.0 |
| 20 | District of Columbia | 1.0 |
| 20 | Washington | 1.0 |
| 20 | Nevada | 1.0 |
| 20 | Arkansas | 1.0 |
| 20 | Colorado | 1.0 |
| 20 | Arizona | 1.0 |
| 27 | Maine | 0.9 |
| 27 | Oregon | 0.9 |
| 27 | Utah | 0.9 |
| 27 | New Hampshire | 0.9 |
| 27 | Tennessee | 0.9 |
| 27 | Pennsylvania | 0.9 |
| 27 | Michigan | 0.9 |
| 34 | Rhode Island | 0.8 |
| 34 | Maryland | 0.8 |
| 34 | New York | 0.8 |
| 34 | Kansas | 0.8 |
| 34 | Oklahoma | 0.8 |
| 34 | New Mexico | 0.8 |
| 40 | Louisiana | 0.7 |
| 40 | Delaware | 0.7 |
| 40 | Texas | 0.7 |
| 40 | Missouri | 0.7 |
| 40 | Connecticut | 0.7 |
| 45 | West Virginia | 0.6 |
| 45 | Florida | 0.6 |
| 47 | Georgia | 0.5 |
| 47 | Alabama | 0.5 |
| 47 | Illinois | 0.5 |
| 47 | Mississippi | 0.5 |
| 51 | Hawaii | 0.3 |
North Dakota leads in speeding incidents
North Dakota had 3.7 speeding incidents per 1,000 drivers, ahead of South Carolina (3.2) and Ohio and Washington (3.0 each). Hawaii, New York, the District of Columbia and Massachusetts tied for the lowest rate at 0.7.
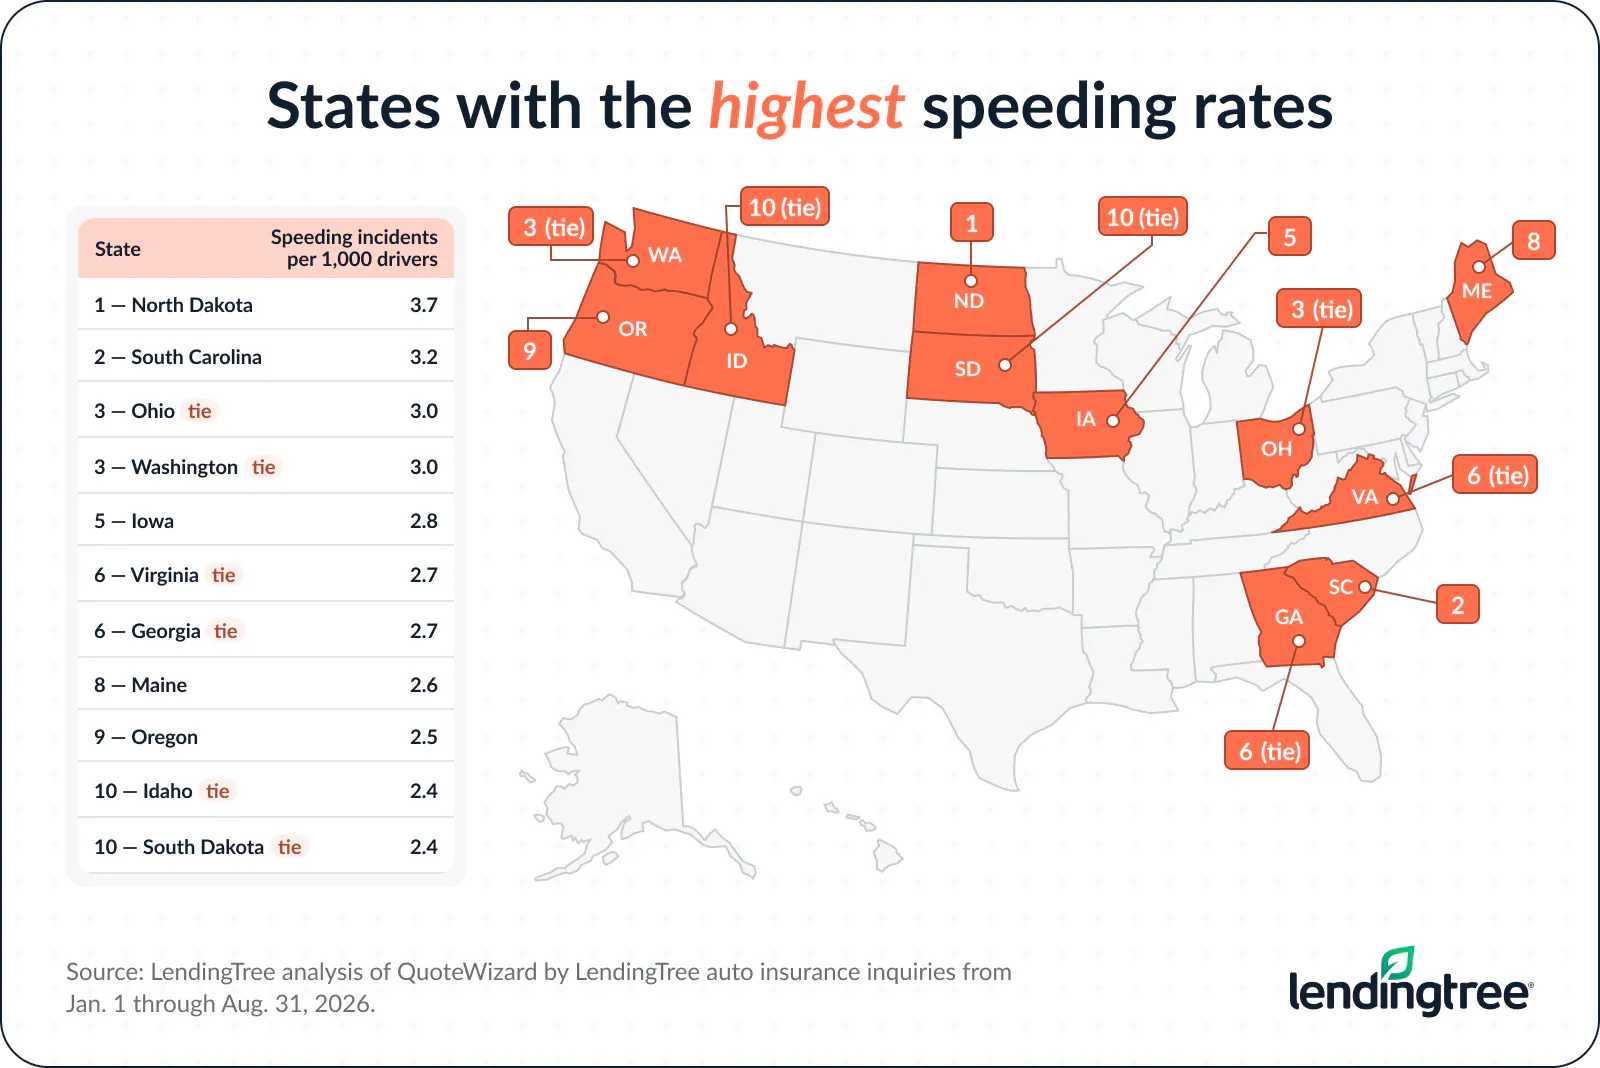
While a speeding ticket will certainly cost you, it’s not the worst mark you can have, Bhatt says.
“Drivers with a speeding ticket pay an average of 24% more for car insurance than drivers with a good record,” he says. “That’s a difference of about $30 a month if your car insurance normally costs $150 a month. A speeding ticket is a pain that’s going to hurt your wallet for a few years, but not by as much as a more serious violation.”
There may also be an option to remediate the issue, such as by taking a class. “It’s usually worth taking a safe-driving class to keep a speeding ticket off your record, if programs like these are available in your area,” Bhatt says.
Related: Auto insurance rates after a speeding ticket study
Full rankings: States with the highest/lowest speeding incident rates
| Rank | State | Speeding incidents per 1,000 drivers |
|---|---|---|
| 1 | North Dakota | 3.7 |
| 2 | South Carolina | 3.2 |
| 3 | Ohio | 3.0 |
| 3 | Washington | 3.0 |
| 5 | Iowa | 2.8 |
| 6 | Virginia | 2.7 |
| 6 | Georgia | 2.7 |
| 8 | Maine | 2.6 |
| 9 | Oregon | 2.5 |
| 10 | Idaho | 2.4 |
| 10 | South Dakota | 2.4 |
| 12 | Utah | 2.3 |
| 12 | Arkansas | 2.3 |
| 14 | Minnesota | 2.2 |
| 14 | Tennessee | 2.2 |
| 16 | Maryland | 2.1 |
| 16 | West Virginia | 2.1 |
| 16 | Wyoming | 2.1 |
| 19 | North Carolina | 2.0 |
| 19 | Wisconsin | 2.0 |
| 19 | Montana | 2.0 |
| 22 | Nevada | 1.9 |
| 22 | Alabama | 1.9 |
| 22 | Oklahoma | 1.9 |
| 25 | Kentucky | 1.8 |
| 25 | Vermont | 1.8 |
| 27 | Indiana | 1.7 |
| 27 | Delaware | 1.7 |
| 27 | Florida | 1.7 |
| 27 | Arizona | 1.7 |
| 27 | Mississippi | 1.7 |
| 32 | Missouri | 1.6 |
| 32 | Colorado | 1.6 |
| 34 | Nebraska | 1.5 |
| 34 | Kansas | 1.5 |
| 34 | Michigan | 1.5 |
| 37 | New Hampshire | 1.4 |
| 37 | Pennsylvania | 1.4 |
| 37 | Texas | 1.4 |
| 37 | New Mexico | 1.4 |
| 41 | Louisiana | 1.3 |
| 42 | Rhode Island | 1.2 |
| 42 | Connecticut | 1.2 |
| 42 | Illinois | 1.2 |
| 45 | New Jersey | 1.0 |
| 45 | California | 1.0 |
| 47 | Alaska | 0.8 |
| 48 | Massachusetts | 0.7 |
| 48 | District of Columbia | 0.7 |
| 48 | New York | 0.7 |
| 48 | Hawaii | 0.7 |
Avoiding costly incidents and keeping rates low: Top insurance tips
You can never be too careful on the road. Whether you live in a state with good drivers or bad ones, here are some tips to keep in mind when it comes to your insurance:
- Stay alert to your surroundings. “The biggest thing is to pay attention to your driving environment, including posted speed limits,” Bhatt says. “Driving is serious business. Even if you’re a safe driver, you can get a speeding ticket if you’re not paying attention or even get into an accident.”
- Leave early. “Give yourself plenty of time to get to your destination,” he says. “If you have to be somewhere by a certain time, leave for it early so you won’t be tempted to speed or take other risks. It’s OK to be late. Getting a ticket or into an accident is going to make you get to your destination even later, and an accident could prevent you from getting there at all.”
- Set up your tech before you go. “Set up your in-car navigation and entertainment before you head out,” he says. “This allows you to focus on the road from the moment you pull out of your parking spot.”
Methodology
Researchers analyzed tens of millions of QuoteWizard by LendingTree auto insurance inquiries from Jan. 1 through Aug. 31, 2026.
To determine the best and worst drivers by state, researchers calculated the number of driving incidents per 1,000 drivers in every state based on the residences listed on the insurance inquiries. This overall measure included accidents, DUIs, speeding-related incidents and general citations.
Researchers analyzed the four categories collectively, as well as accidents, DUIs and speeding-related incidents individually.
General citations included:
- Carelessness or recklessness
- Improper lane usage, improper passing and improper turning
- No insurance or no license to operate a vehicle, or misrepresenting a license
- Failure to yield to a car or pedestrian
- Safety violations, following another vehicle closely and passing a bus
- Not signaling
- Hit-and-runs involving a bicycle or pedestrian
- Having defective equipment or using the wrong road
- Comprehensive or other citations