Fair Market Rents Have Risen More Than 35% Since 2022 Across the 50 Largest US Metros


Fair Market Rents have risen by more than a third on average — and by more than 60% in some cases — in the nation’s 50 largest metros between fiscal years 2022 and 2027.
According to a LendingTree analysis of U.S. Department of Housing and Urban Development (HUD) data, Indianapolis recorded the largest percentage increase over that period for both one- and two-bedroom units. Meanwhile, California accounted for many of the metros with the highest Fair Market Rents.
Here’s more of what we found.
The U.S. Department of Housing and Urban Development defines Fair Market Rents, or FMRs, as “estimates of 40th-percentile gross rents for standard-quality units within a metropolitan area or nonmetropolitan county.” These properties include rental houses, apartments and other types of homes. Gross rent includes the monthly rent specified in a lease and utilities paid by tenants, excluding telephone, cable or satellite television and internet service. In other words, an FMR estimates the gross rent at or below which 40% of qualifying, standard-quality rental units occupied by recent movers are priced in a given area.
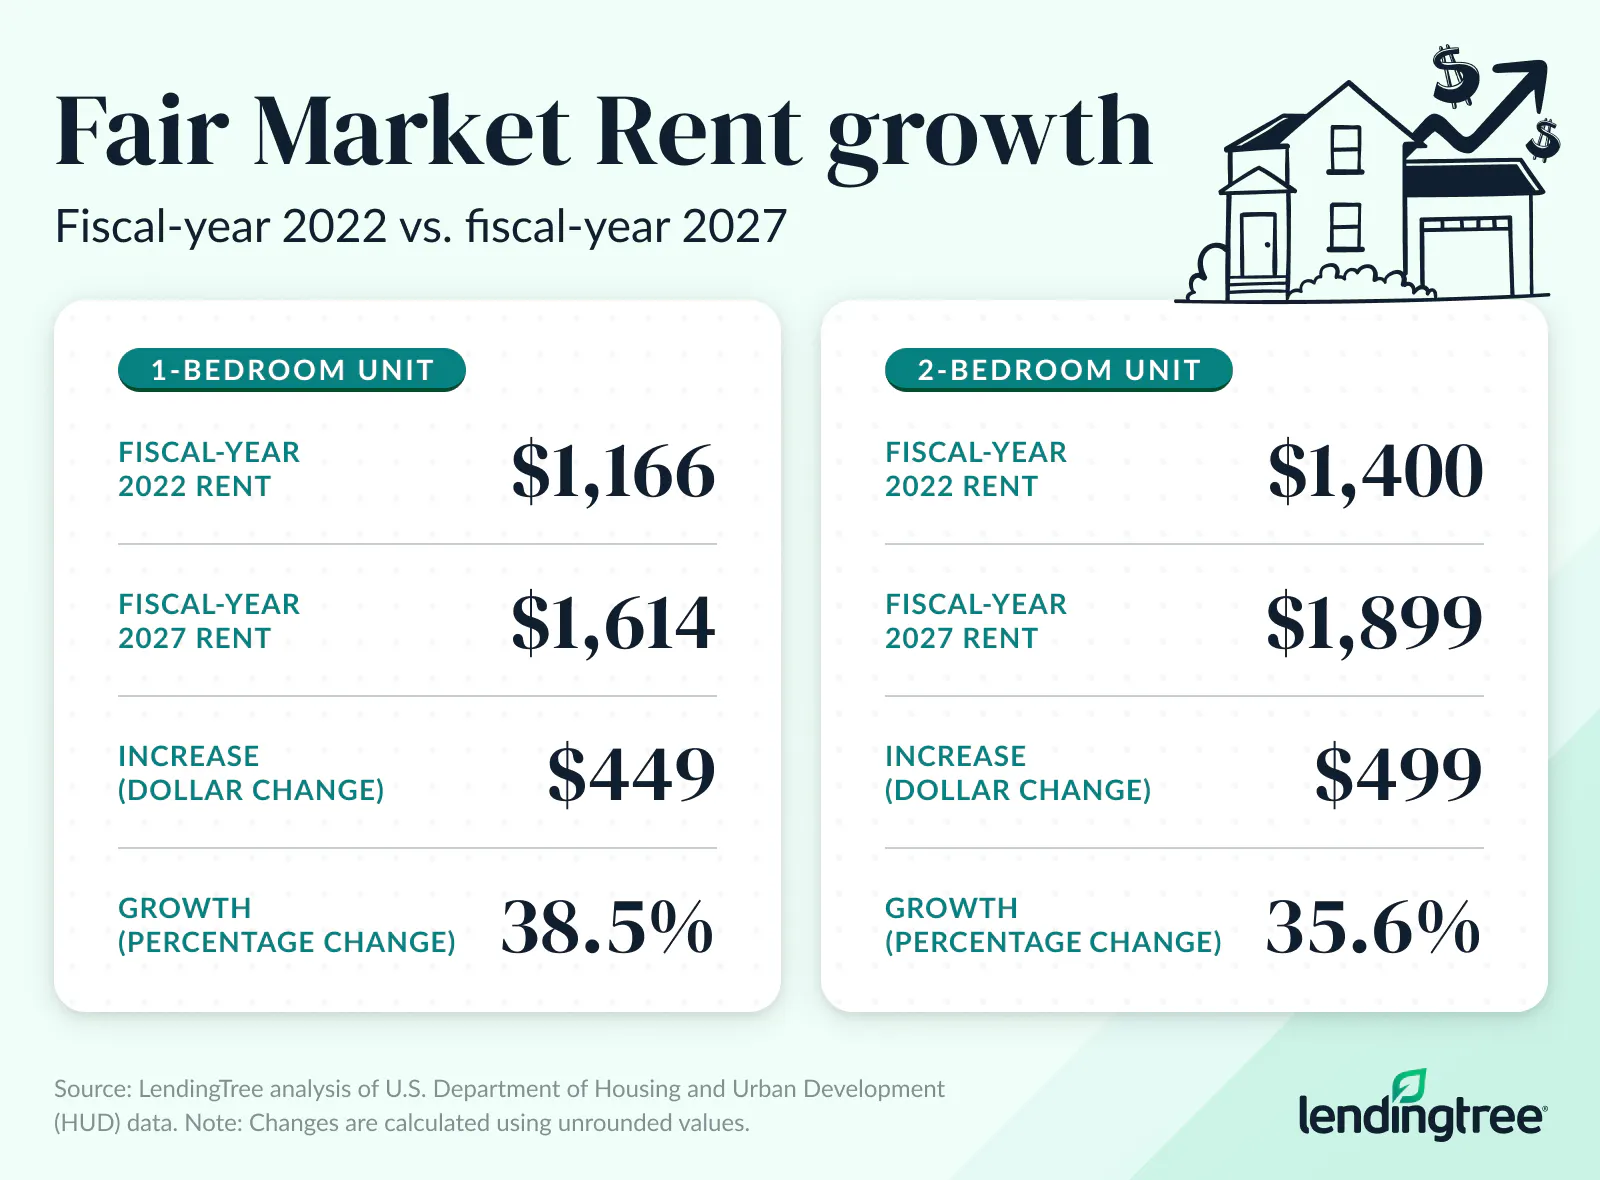
- Fair Market Rents rose by more than a third on average across the nation’s 50 largest metros between fiscal years 2022 and 2027. All 50 metros saw increases for both one- and two-bedroom units. Over that period, one-bedroom Fair Market Rents increased by an average of 38.5%, or $449 per month, while two-bedroom Fair Market Rents rose by an average of 35.6%, or $499 per month.
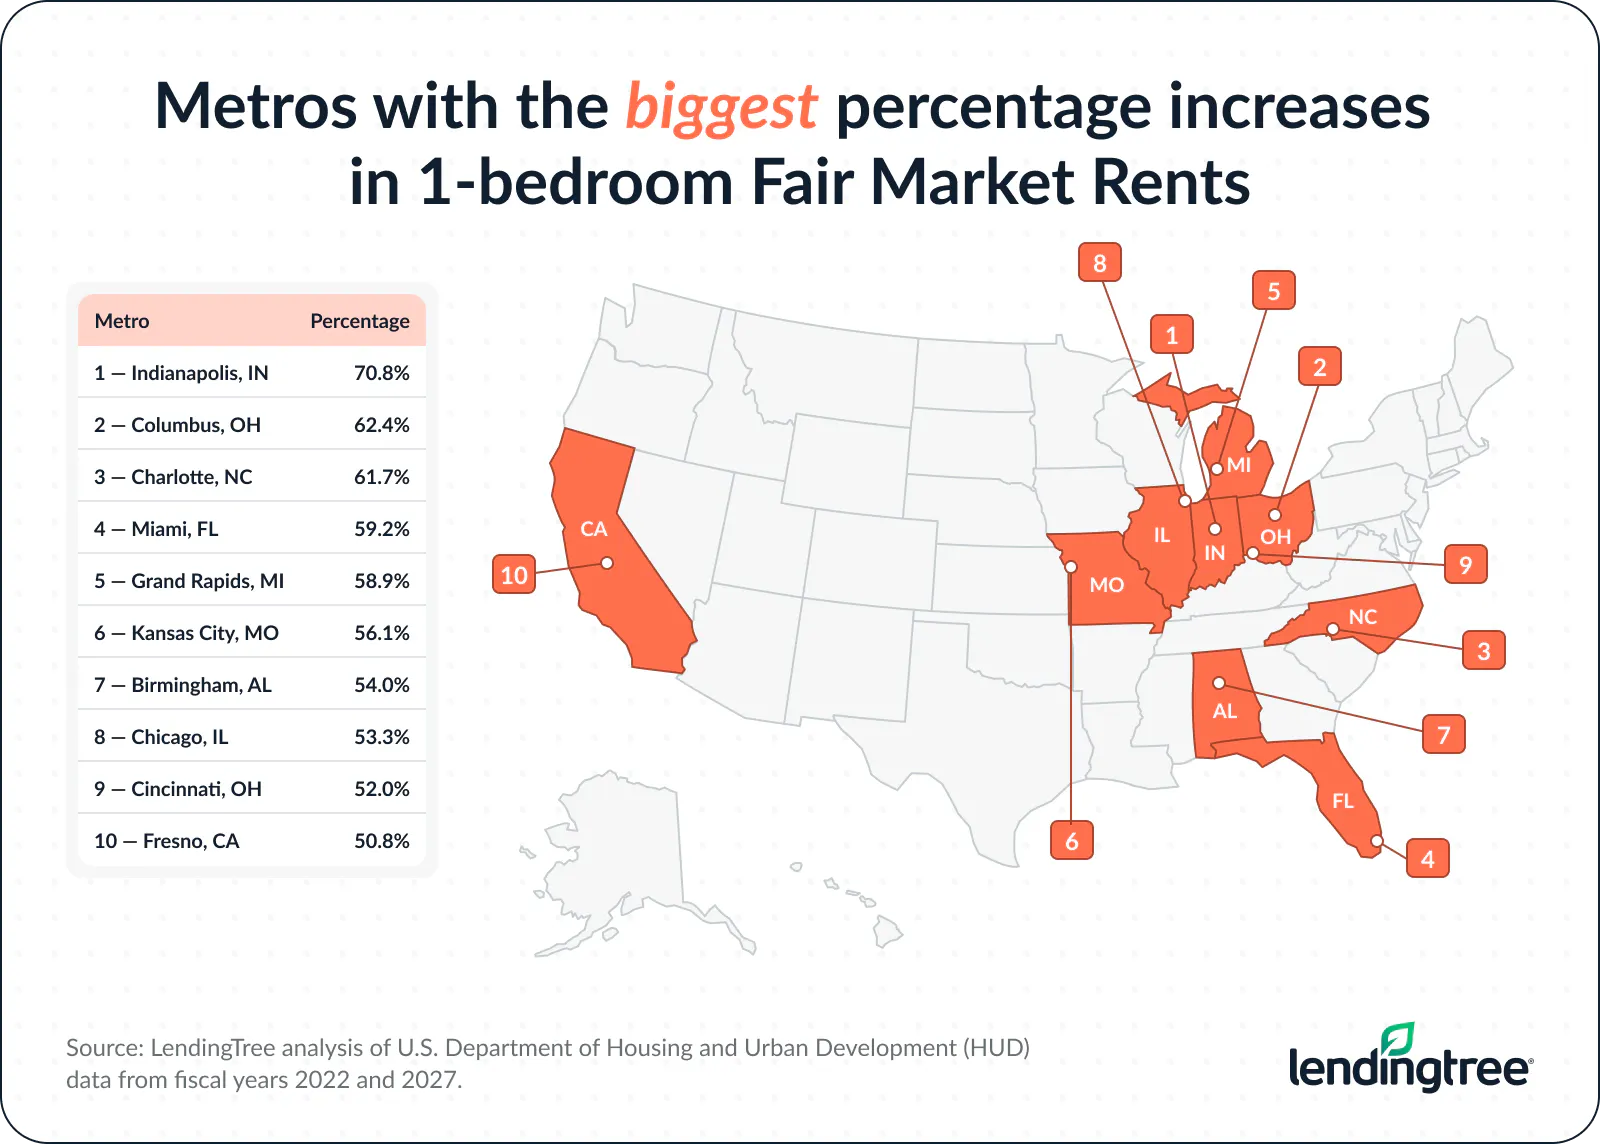
- Indianapolis saw the largest percentage increase in Fair Market Rent for both one- and two-bedroom units over that period, while Portland, Ore., saw the smallest. Fair Market Rents for one-bedroom units in Indianapolis rose 70.8%, followed by Columbus, Ohio (62.4%), and Charlotte, N.C. (61.7%). For two-bedroom units, Indianapolis saw a 63.6% increase, followed by Grand Rapids, Mich. (56.6%), and Columbus (55.2%). Meanwhile, Portland saw Fair Market Rents for one- and two-bedroom units rise 8.0% and 8.2%, respectively.
- San Francisco had the highest one- and two-bedroom Fair Market Rents in fiscal-year 2027. San Francisco’s Fair Market Rent was $3,003 per month for a one-bedroom unit and $3,697 per month for a two-bedroom unit. Despite having the highest rents, San Francisco recorded the second-smallest percentage increase for one-bedroom units and the third-smallest for two-bedroom units since fiscal-year 2022. Only two other metros — San Jose, Calif. ($3,272), and Boston ($3,008) — had two-bedroom Fair Market Rents above $3,000 per month.
- Oklahoma City had the lowest one-bedroom Fair Market Rent, while Milwaukee had the lowest two-bedroom Fair Market Rent in fiscal-year 2027. A one-bedroom unit in Oklahoma City had a Fair Market Rent of $1,040 per month, the lowest among the nation’s 50 largest metros. Oklahoma City also had the second-lowest two-bedroom Fair Market Rent at $1,264 per month, just $1 more than Milwaukee ($1,263).
Fair Market Rents rose by more than a third on average across the nation’s largest metros
Fair Market Rents increased for both one- and two-bedroom units in all 50 of the nation’s largest metros.
Between fiscal years 2022 and 2027, one-bedroom Fair Market Rents in these metros increased by an average of 38.5%, or $449 per month. Meanwhile, two-bedroom Fair Market Rents rose by a slightly smaller percentage of 35.6% but a larger dollar amount of $499 per month.
These increases can put significant pressure on household budgets, particularly for renters whose wages haven’t kept pace. Annual wage growth reached a recent peak of 5.7% in June 2022, according to the U.S. Bureau of Labor Statistics, before slowing. As of June 2026, the latest period for which data is available, year-over-year wage growth for U.S. private-sector workers had remained at or below 3.8% for eight consecutive quarters.
Indianapolis saw the largest Fair Market Rent percentage increases, while Portland, Ore., saw the smallest
Twelve of the nation’s 50 largest metros saw Fair Market Rents for one-bedroom units rise by at least 50.0% between fiscal years 2022 and 2027. Eight metros saw at least 50.0% growth in two-bedroom Fair Market Rents during the same period. In both cases, Indianapolis recorded the largest percentage increases.
Fair Market Rents for one-bedroom units in Indianapolis rose 70.8%, far above the 50-metro average of 38.5%. Columbus, Ohio (62.4%), and Charlotte, N.C. (61.7%), were the only other metros where increases exceeded 60.0%. For two-bedroom units, Fair Market Rents in Indianapolis rose 63.6%, again leading the nation’s largest metros. Grand Rapids, Mich. (56.6%), and Columbus (55.2%) rounded out the top three.
In dollar terms, Los Angeles and Miami saw the largest increases in both one- and two-bedroom Fair Market Rents during the period. Their one-bedroom FMRs rose by $798 and $789, respectively, while their two-bedroom FMRs rose by $920 and $892, respectively.
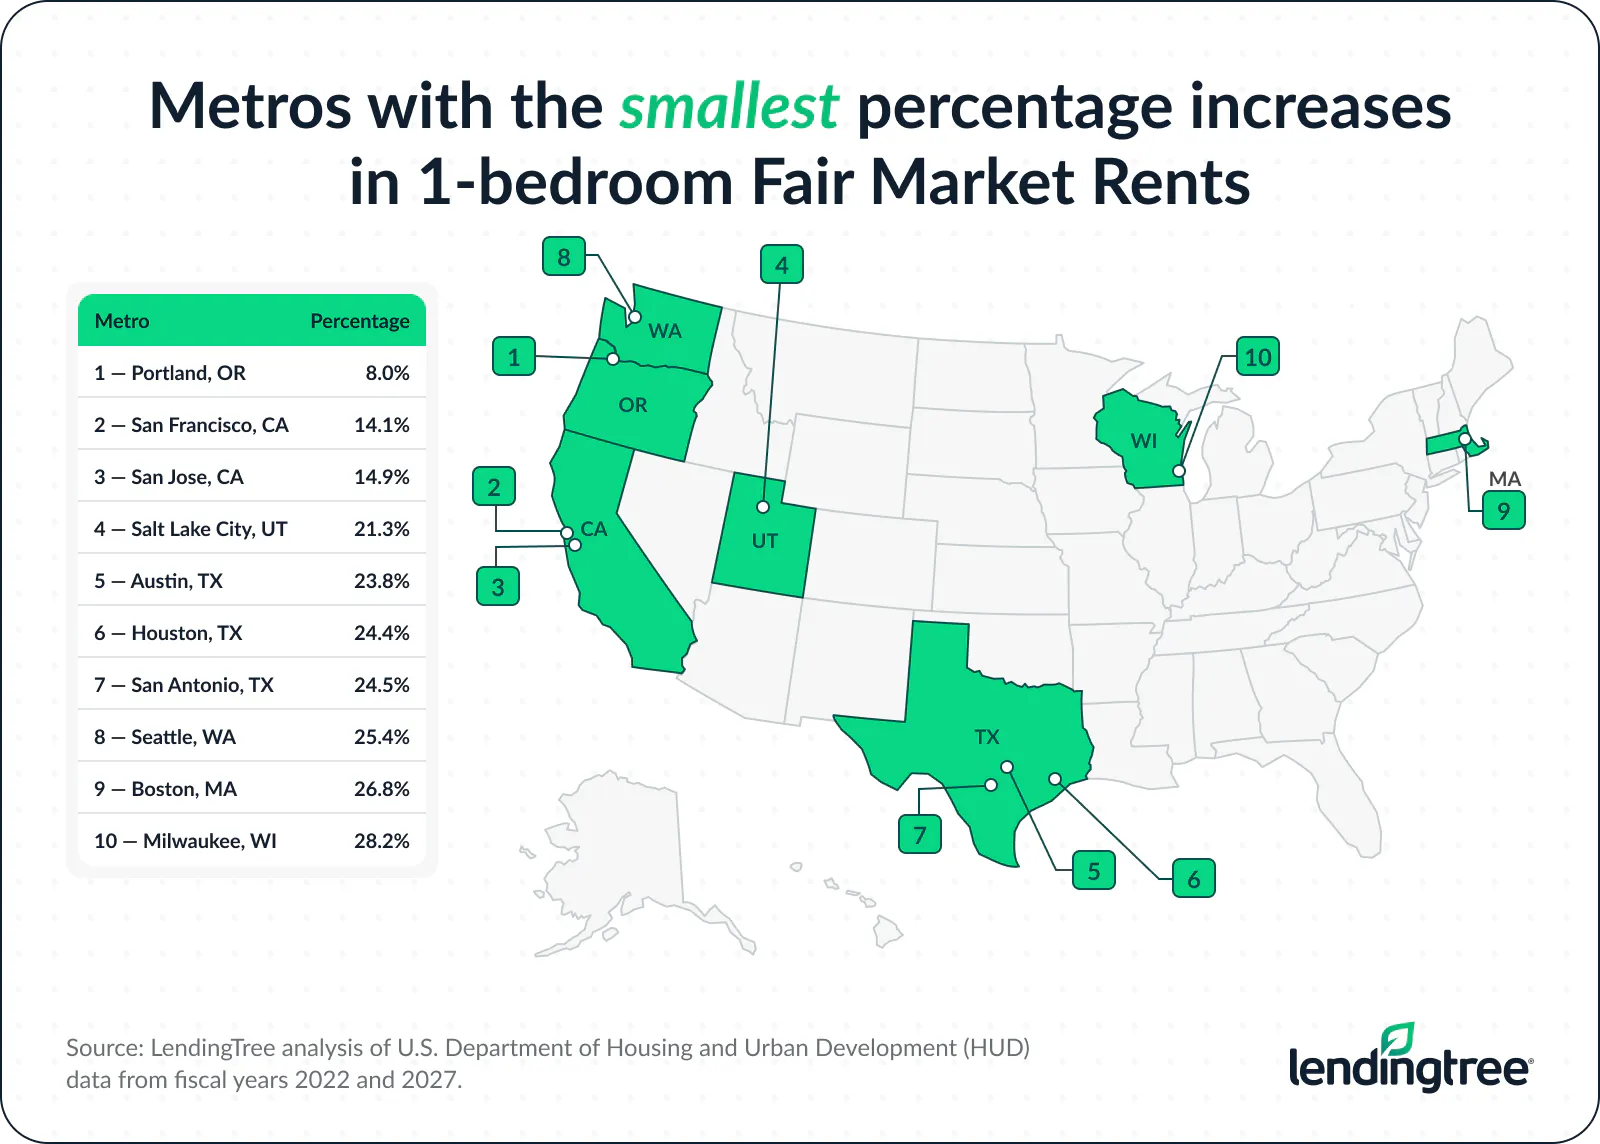
While all 50 metros saw Fair Market Rents rise between fiscal years 2022 and 2027, the magnitude of that growth varied widely. Three metros — Portland, Ore.; San Francisco and San Jose, Calif. — saw increases of less than 20.0% for both one- and two-bedroom units.
Portland had the smallest percentage increase, with Fair Market Rents for one- and two-bedroom units rising just 8.0% and 8.2%, respectively. It was the only one of the nation’s 50 largest metros to record single-digit growth for both unit types during the period.
Portland, Milwaukee and San Antonio saw the smallest dollar increases in Fair Market Rents for both one- and two-bedroom units. One-bedroom FMRs rose by $121, $233 and $235, respectively, while two-bedroom FMRs increased by $143, $264 and $276, respectively.
San Francisco had the highest 1- and 2-bedroom Fair Market Rents
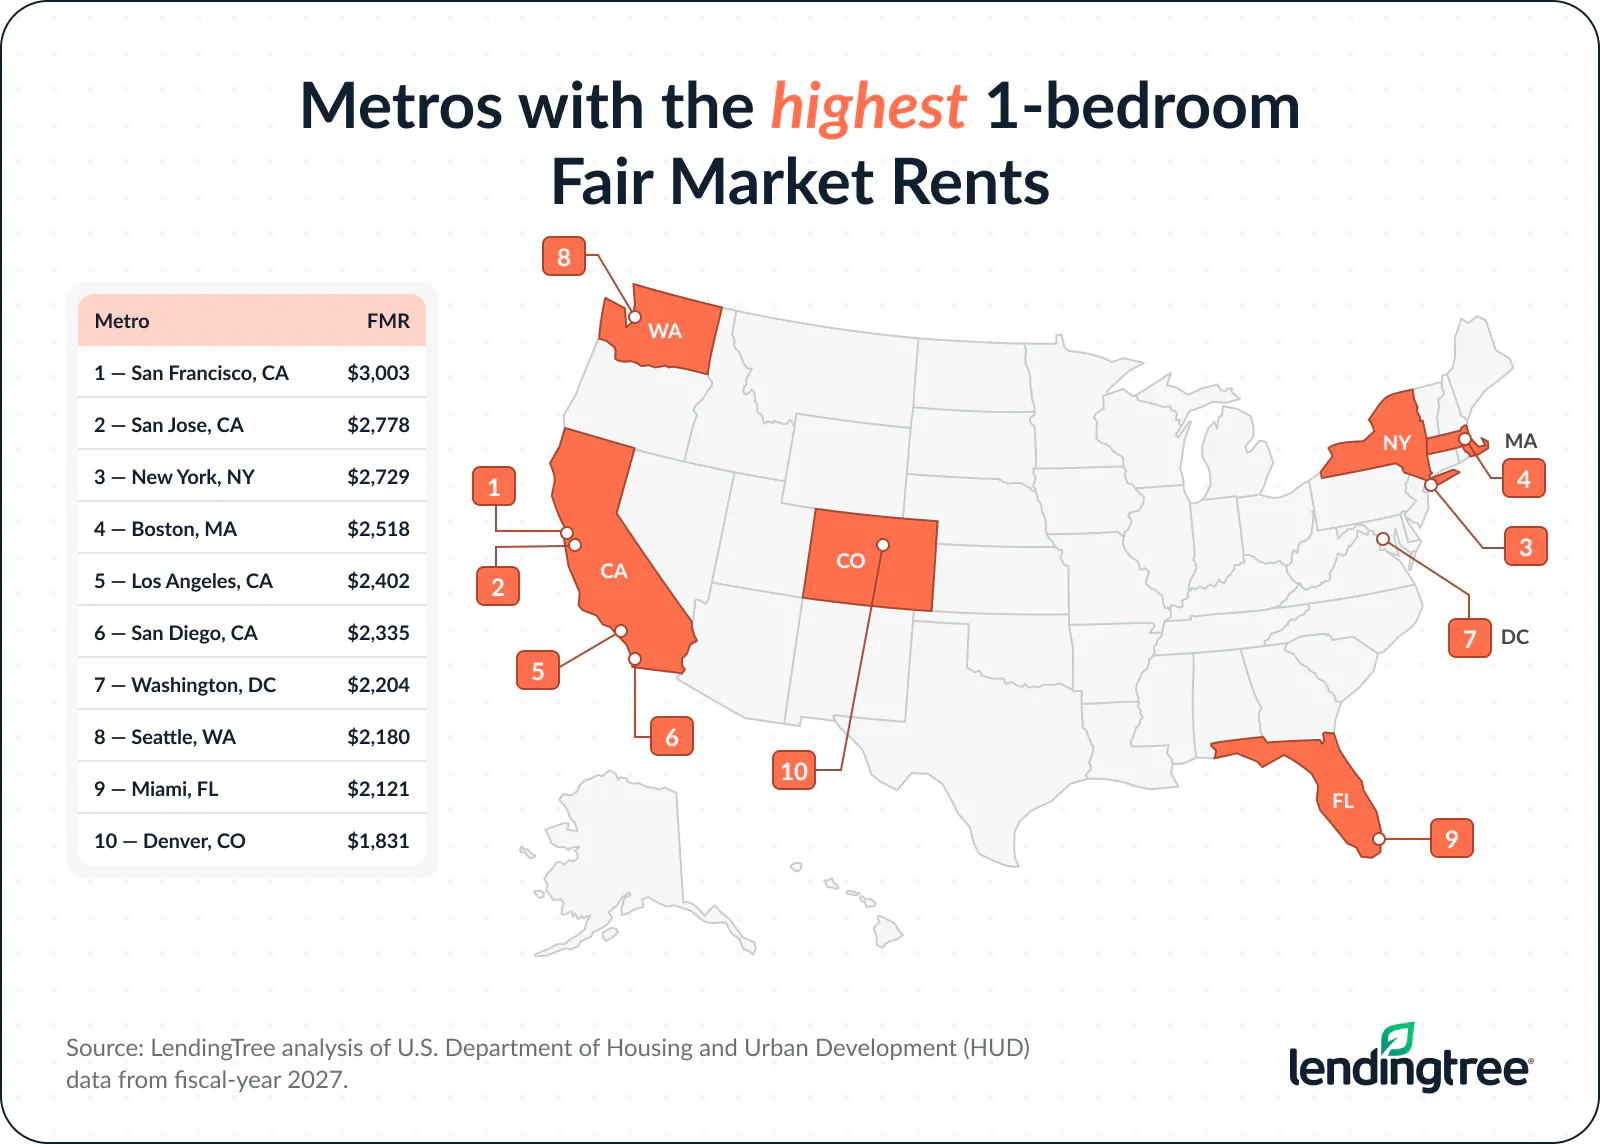
California accounted for most of the metros with the highest Fair Market Rents. Among the 50 largest metros, four of the six highest one-bedroom Fair Market Rents were in the Golden State, as were four of the six highest two-bedroom FMRs.
San Francisco and San Jose ranked first and second, respectively, for both unit types, while Los Angeles and San Diego also ranked among the six most expensive metros.
At $3,003 per month for a one-bedroom unit, San Francisco was the only metro with a one-bedroom Fair Market Rent of $3,000 or higher. (The next closest were San Jose at $2,778 and New York at $2,729.) Meanwhile, San Francisco, at $3,697 per month, was one of just three metros — along with San Jose ($3,272) and Boston ($3,008) — with two-bedroom Fair Market Rents above $3,000 per month.
Despite having the highest Fair Market Rents, San Francisco saw relatively modest percentage increases during the period. It recorded the second-smallest percentage increase for one-bedroom units and the third-smallest for two-bedroom units between fiscal years 2022 and 2027.
Oklahoma City had the lowest 1-bedroom Fair Market Rent, Milwaukee the lowest 2-bedroom rate
Several metros in the Midwest and South had substantially lower Fair Market Rents than San Francisco and other expensive coastal metros.
In fiscal-year 2027, the lowest one-bedroom Fair Market Rent was in Oklahoma City, at $1,040 per month. That’s nearly $2,000 less per month than in San Francisco, meaning the Fair Market Rent for a one-bedroom unit in San Francisco was nearly three times as high as in Oklahoma City. Cleveland ($1,050), Louisville, Ky. ($1,058), and Milwaukee ($1,060) weren’t much higher.
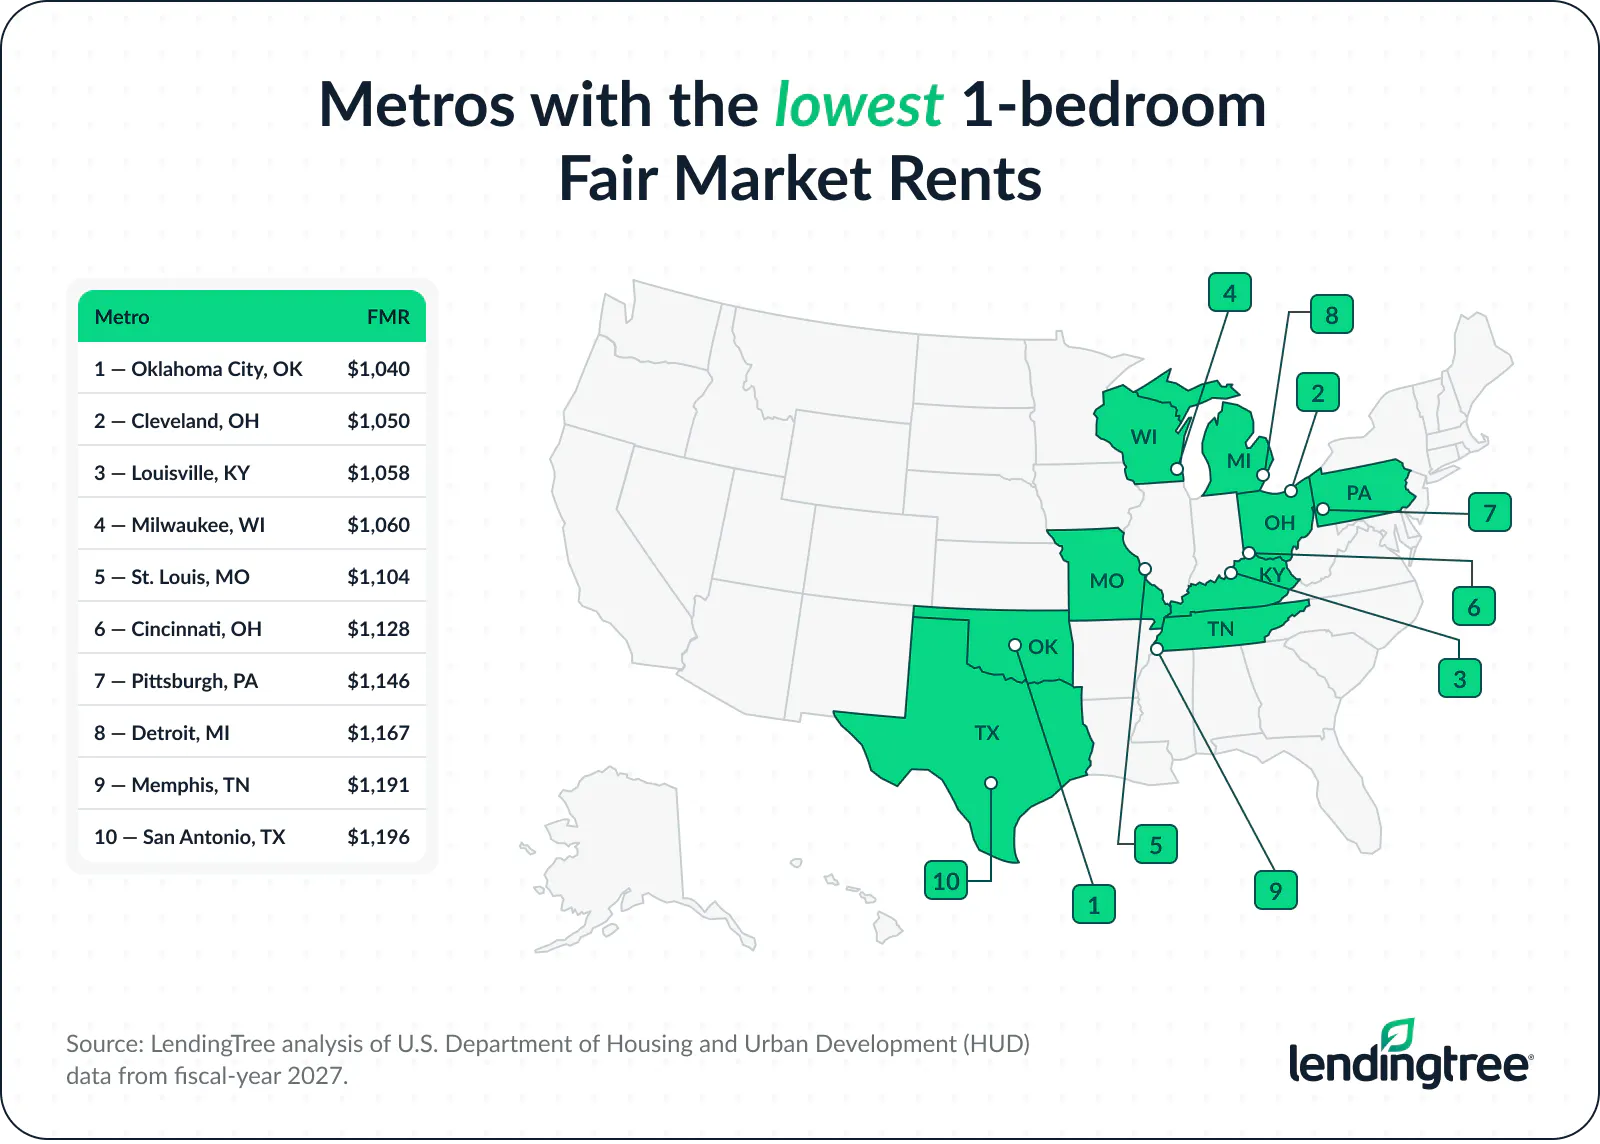
For two-bedroom units, Milwaukee ($1,263 per month) had the lowest Fair Market Rent, with Oklahoma City second at $1,264 per month. As with one-bedroom rents, Cleveland ($1,274) and Louisville ($1,276) weren’t far behind.
Full rankings: Metros with the largest percentage increases in 1-bedroom Fair Market Rents
| Rank | Metro | FMR, FY 2022 | FMR, FY 2027 | $ change | % change |
|---|---|---|---|---|---|
| 1 | Indianapolis, IN | $782 | $1,336 | $554 | 70.8% |
| 2 | Columbus, OH | $829 | $1,346 | $517 | 62.4% |
| 3 | Charlotte, NC | $1,014 | $1,640 | $626 | 61.7% |
| 4 | Miami, FL | $1,332 | $2,121 | $789 | 59.2% |
| 5 | Grand Rapids, MI | $859 | $1,365 | $506 | 58.9% |
| 6 | Kansas City, MO | $875 | $1,366 | $491 | 56.1% |
| 7 | Birmingham, AL | $820 | $1,263 | $443 | 54.0% |
| 8 | Chicago, IL | $1,161 | $1,780 | $619 | 53.3% |
| 9 | Cincinnati, OH | $742 | $1,128 | $386 | 52.0% |
| 10 | Fresno, CA | $904 | $1,363 | $459 | 50.8% |
| 11 | Memphis, TN | $792 | $1,191 | $399 | 50.4% |
| 12 | Nashville, TN | $1,100 | $1,650 | $550 | 50.0% |
| 13 | Los Angeles, CA | $1,604 | $2,402 | $798 | 49.8% |
| 14 | Tampa, FL | $1,110 | $1,648 | $538 | 48.5% |
| 15 | St. Louis, MO | $745 | $1,104 | $359 | 48.2% |
| 16 | Providence, RI | $1,026 | $1,509 | $483 | 47.1% |
| 17 | Virginia Beach, VA | $1,015 | $1,488 | $473 | 46.6% |
| 18 | Hartford, CT | $1,054 | $1,543 | $489 | 46.4% |
| 19 | Sacramento, CA | $1,228 | $1,793 | $565 | 46.0% |
| 20 | Philadelphia, PA | $1,071 | $1,558 | $487 | 45.5% |
| 21 | Richmond, VA | $1,044 | $1,517 | $473 | 45.3% |
| 22 | Raleigh, NC | $1,073 | $1,552 | $479 | 44.6% |
| 22 | Baltimore, MD | $1,124 | $1,625 | $501 | 44.6% |
| 24 | Cleveland, OH | $732 | $1,050 | $318 | 43.4% |
| 25 | Atlanta, GA | $1,131 | $1,619 | $488 | 43.1% |
| 26 | Jacksonville, FL | $995 | $1,421 | $426 | 42.8% |
| 26 | Las Vegas, NV | $1,005 | $1,435 | $430 | 42.8% |
| 28 | Pittsburgh, PA | $807 | $1,146 | $339 | 42.0% |
| 29 | Riverside, CA | $1,202 | $1,705 | $503 | 41.8% |
| 30 | Washington, DC | $1,567 | $2,204 | $637 | 40.7% |
| 31 | Orlando, FL | $1,237 | $1,726 | $489 | 39.5% |
| 32 | Oklahoma City, OK | $746 | $1,040 | $294 | 39.4% |
| 33 | Detroit, MI | $848 | $1,167 | $319 | 37.6% |
| 34 | Phoenix, AZ | $1,091 | $1,493 | $402 | 36.8% |
| 35 | San Diego, CA | $1,739 | $2,335 | $596 | 34.3% |
| 36 | Denver, CO | $1,364 | $1,831 | $467 | 34.2% |
| 37 | Dallas, TX | $1,150 | $1,536 | $386 | 33.6% |
| 38 | New York, NY | $2,054 | $2,729 | $675 | 32.9% |
| 39 | Minneapolis, MN | $1,078 | $1,427 | $349 | 32.4% |
| 40 | Louisville, KY | $800 | $1,058 | $258 | 32.3% |
| 41 | Milwaukee, WI | $827 | $1,060 | $233 | 28.2% |
| 42 | Boston, MA | $1,986 | $2,518 | $532 | 26.8% |
| 43 | Seattle, WA | $1,739 | $2,180 | $441 | 25.4% |
| 44 | San Antonio, TX | $961 | $1,196 | $235 | 24.5% |
| 45 | Houston, TX | $1,014 | $1,261 | $247 | 24.4% |
| 46 | Austin, TX | $1,236 | $1,530 | $294 | 23.8% |
| 47 | Salt Lake City, UT | $1,112 | $1,349 | $237 | 21.3% |
| 48 | San Jose, CA | $2,418 | $2,778 | $360 | 14.9% |
| 49 | San Francisco, CA | $2,631 | $3,003 | $372 | 14.1% |
| 50 | Portland, OR | $1,512 | $1,633 | $121 | 8.0% |
Full rankings: Metros with the largest percentage increases in 2-bedroom Fair Market Rents
| Rank | Metro | FMR, FY 2022 | FMR, FY 2027 | $ change | % change |
|---|---|---|---|---|---|
| 1 | Indianapolis, IN | $939 | $1,536 | $597 | 63.6% |
| 2 | Grand Rapids, MI | $1,041 | $1,630 | $589 | 56.6% |
| 3 | Columbus, OH | $1,032 | $1,602 | $570 | 55.2% |
| 4 | Charlotte, NC | $1,155 | $1,785 | $630 | 54.5% |
| 5 | Miami, FL | $1,672 | $2,564 | $892 | 53.3% |
| 6 | Providence, RI | $1,234 | $1,879 | $645 | 52.3% |
| 7 | Kansas City, MO | $1,030 | $1,546 | $516 | 50.1% |
| 7 | Chicago, IL | $1,340 | $2,011 | $671 | 50.1% |
| 9 | Cincinnati, OH | $968 | $1,442 | $474 | 49.0% |
| 10 | Hartford, CT | $1,302 | $1,933 | $631 | 48.5% |
| 11 | Fresno, CA | $1,137 | $1,685 | $548 | 48.2% |
| 12 | Birmingham, AL | $943 | $1,375 | $432 | 45.8% |
| 13 | Los Angeles, CA | $2,044 | $2,964 | $920 | 45.0% |
| 14 | Baltimore, MD | $1,395 | $2,006 | $611 | 43.8% |
| 15 | Nashville, TN | $1,253 | $1,798 | $545 | 43.5% |
| 16 | Philadelphia, PA | $1,298 | $1,860 | $562 | 43.3% |
| 17 | Cleveland, OH | $893 | $1,274 | $381 | 42.7% |
| 17 | Memphis, TN | $912 | $1,301 | $389 | 42.7% |
| 19 | Sacramento, CA | $1,543 | $2,201 | $658 | 42.6% |
| 19 | Jacksonville, FL | $1,188 | $1,694 | $506 | 42.6% |
| 21 | St. Louis, MO | $947 | $1,349 | $402 | 42.4% |
| 22 | Tampa, FL | $1,347 | $1,917 | $570 | 42.3% |
| 23 | Pittsburgh, PA | $981 | $1,389 | $408 | 41.6% |
| 24 | Virginia Beach, VA | $1,193 | $1,667 | $474 | 39.7% |
| 25 | Riverside, CA | $1,509 | $2,103 | $594 | 39.4% |
| 26 | Richmond, VA | $1,189 | $1,651 | $462 | 38.9% |
| 27 | Las Vegas, NV | $1,216 | $1,686 | $470 | 38.7% |
| 28 | Raleigh, NC | $1,223 | $1,689 | $466 | 38.1% |
| 29 | Orlando, FL | $1,422 | $1,959 | $537 | 37.8% |
| 30 | Atlanta, GA | $1,289 | $1,762 | $473 | 36.7% |
| 31 | Washington, DC | $1,785 | $2,438 | $653 | 36.6% |
| 32 | Oklahoma City, OK | $927 | $1,264 | $337 | 36.4% |
| 33 | Detroit, MI | $1,084 | $1,459 | $375 | 34.6% |
| 34 | Louisville, KY | $960 | $1,276 | $316 | 32.9% |
| 35 | Dallas, TX | $1,362 | $1,807 | $445 | 32.7% |
| 36 | Phoenix, AZ | $1,311 | $1,734 | $423 | 32.3% |
| 37 | Denver, CO | $1,659 | $2,169 | $510 | 30.7% |
| 38 | Minneapolis, MN | $1,329 | $1,734 | $405 | 30.5% |
| 39 | New York, NY | $2,340 | $2,971 | $631 | 27.0% |
| 40 | San Diego, CA | $2,232 | $2,823 | $591 | 26.5% |
| 41 | Milwaukee, WI | $999 | $1,263 | $264 | 26.4% |
| 42 | Boston, MA | $2,399 | $3,008 | $609 | 25.4% |
| 43 | Austin, TX | $1,451 | $1,817 | $366 | 25.2% |
| 44 | Seattle, WA | $2,044 | $2,549 | $505 | 24.7% |
| 45 | Houston, TX | $1,208 | $1,497 | $289 | 23.9% |
| 46 | San Antonio, TX | $1,165 | $1,441 | $276 | 23.7% |
| 47 | Salt Lake City, UT | $1,327 | $1,615 | $288 | 21.7% |
| 48 | San Francisco, CA | $3,198 | $3,697 | $499 | 15.6% |
| 49 | San Jose, CA | $2,868 | $3,272 | $404 | 14.1% |
| 50 | Portland, OR | $1,735 | $1,878 | $143 | 8.2% |
How to manage rising rental costs
Renters may not control the rents landlords charge, but they can take steps to manage their housing costs.
- Negotiate before accepting a rent increase. Don’t assume a proposed increase from your landlord is final. Compare rents for similar properties in your area. If you’ve paid rent on time and taken good care of the property, highlight your track record as a tenant. You can also ask whether signing a longer lease could mean a smaller increase. Your landlord may not agree, but negotiating could help you save.
- Look at the total cost. The advertised rent is only part of the expense. Parking, utilities, pet fees and other charges can make a seemingly cheaper apartment more expensive. Before signing a lease, ask for a breakdown of required charges and estimate your full monthly cost. This will give you a clearer picture of what you can afford.
- Start shopping early. Waiting until your lease is about to expire can leave you with fewer choices. Give yourself time to compare properties and explore nearby neighborhoods where rents may be lower. Factor in commuting and other potential costs when comparing options. A lower rent may not save you money if other expenses increase.
- Research rental assistance. If rent is taking up more of your income than you can manage, look into local housing assistance programs, income-restricted apartments and other available resources. Eligibility and availability vary, and some programs may have long waiting lists. Starting early can give you more time to explore your options before you face financial hardship.
- Do the math before moving. A cheaper apartment may save you money each month, but moving comes with upfront costs. Security deposits, application fees, moving expenses and possible lease-breaking penalties can add up quickly. Calculate how long it would take for the monthly savings to cover those costs. In some cases, negotiating a smaller rent increase with your current landlord may be the better financial move.
Methodology
LendingTree analysts compared U.S. Department of Housing and Urban Development (HUD) Fair Market Rent (FMR) data for fiscal years 2022 and 2027 across the 50 largest U.S. metros. The analysis focuses on changes in FMRs for one- and two-bedroom units.
HUD defines Fair Market Rents as “estimates of 40th-percentile gross rents for standard-quality units within a metropolitan area or nonmetropolitan county.” Gross rent includes the monthly contract rent specified in a lease and tenant-paid utilities. To calculate FMRs, HUD uses American Community Survey rent data and adjusts its estimates using recent-mover, rent-inflation and trend factors. HUD excludes public housing units and units built within the past two years.
FMRs don’t represent every rental unit or the average asking rent in a market. However, they provide a consistent benchmark for comparing rent levels and changes across areas over time.
View mortgage loan offers from up to 5 lenders in minutes
Recommended Articles
1 in 3 Homeowners Put Off Needed Repairs; 34% of Those With Outstanding Repairs Say Delays Increased Costs
59% of Mortgage Holders Say They’re ‘House Poor,’ and Half Have Struggled to Pay Their Mortgage in Full
Borrowers With the Lowest Mortgage Rates Could Save Over $43,000 — Here’s What Sets Them Apart