Best Metros to Start a Small Business in 2026


The success of starting a business can depend partly on where you launch it. Talent, taxes and the local job market can all help a small business — or hurt it.
The reality is, some metros may offer more favorable conditions for starting a small business than others. According to a LendingTree analysis of business climate, entrepreneurship and local economic factors, Raleigh, N.C., ranks as the best metro to start a small business, while Fresno, Calif., ranks last among the 100 largest U.S. metros. Here’s a closer look at how the metros measure up.
- Raleigh, N.C., is the best metro to start a small business, followed by Austin, Texas, and Des Moines, Iowa. Raleigh has the sixth-highest percentage of residents ages 25 and older with at least a bachelor’s degree (52.5%) and the eighth-highest share of residents in their prime working years, ages 25 to 54 (43.0%).
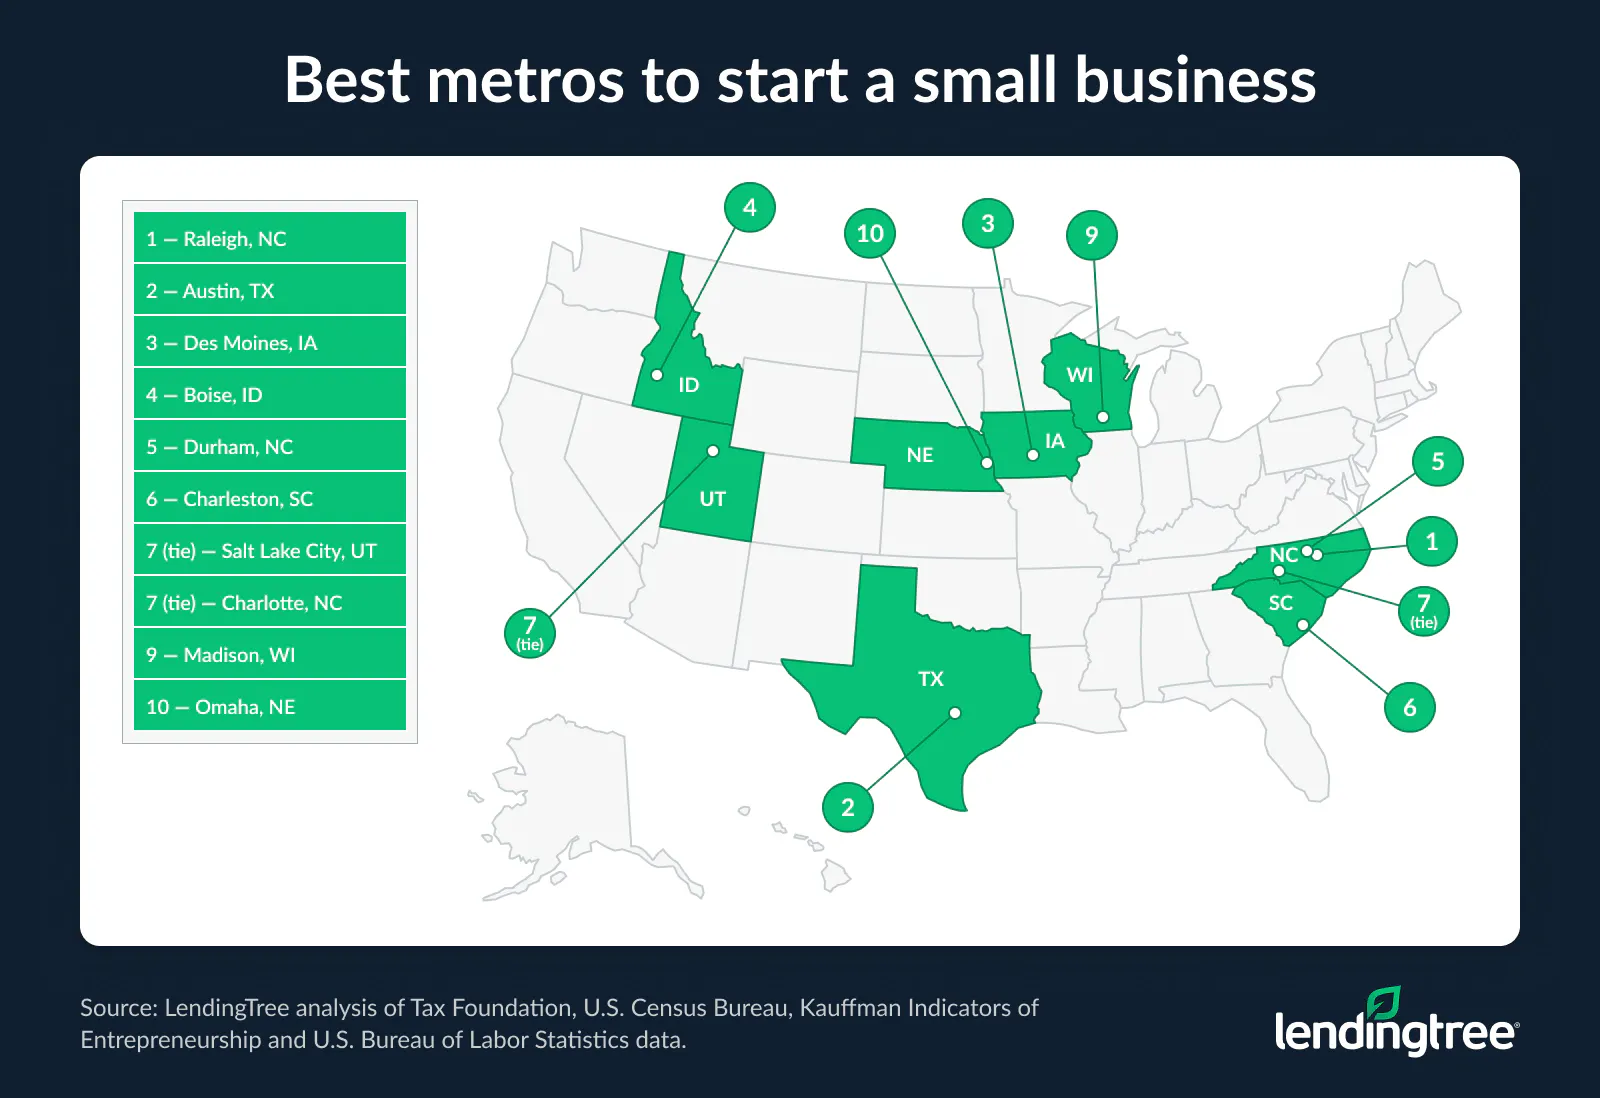
- Each of the top 10 metros is in the South, Midwest or West. The South claims five spots, with Raleigh, Austin, Durham, N.C., Charleston, S.C., and Charlotte, N.C. Meanwhile, Des Moines, Madison, Wis., and Omaha, Neb., represent the Midwest, and Boise, Idaho, and Salt Lake City represent the West.
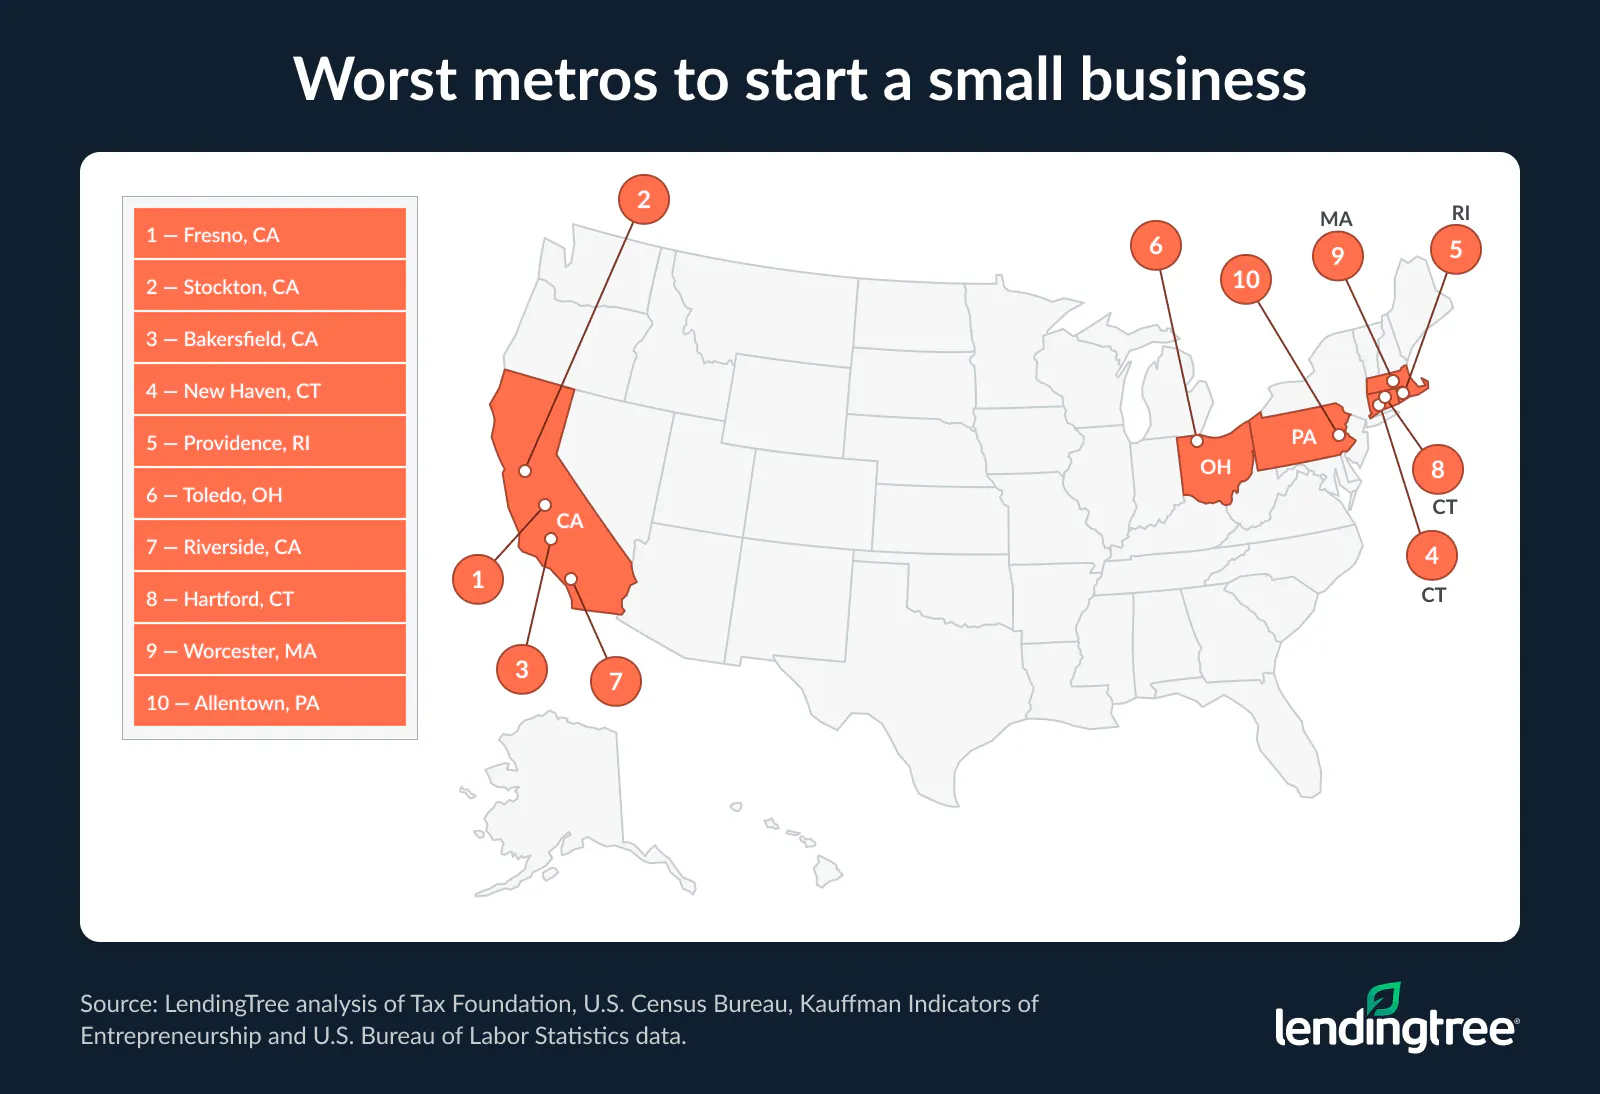
- Fresno, Stockton and Bakersfield in California are the worst metros for starting a small business. Bakersfield has both the lowest percentage of residents with at least a bachelor’s degree (19.3%) and the highest unemployment rate (8.6%).
- Orlando, Fla., earns the highest entrepreneurship score but ranks just 21st overall. Its perfect 100.0 entrepreneurship score is offset by its local economy score of 8.5. Austin ranks first in business climate and Des Moines ranks first in local economy, each with a score of 100.0.
Raleigh, N.C., leads the best metros for small businesses
Raleigh, N.C., takes the top spot as the best metro for a small business. Raleigh’s strength is its workforce: 52.5% of residents ages 25 and older hold at least a bachelor’s degree — the sixth-highest share among the metros studied. It also has the eighth-highest concentration of people in their prime working years, with 43.0% between 25 and 54.
This mix of educated workers and people in their prime working years can be a real advantage, according to Matt Schulz, LendingTree chief consumer finance analyst and author of “Ask Questions, Save Money, Make More: How to Take Control of Your Financial Life.”
“It gives growing businesses a strong pool of potential employees, as well as plenty of possible customers,” he says. “That doesn’t guarantee success, of course, but it can make it easier for a small business to find the people it needs to take that next step.”
Notably, Raleigh doesn’t lead in any of the three categories analyzed. However, it’s the only metro to score at least a 70 in all three, with an 84.3 in business climate, 71.5 in entrepreneurship and 86.5 in local economy. (See the methodology for more on how LendingTree scored each metro.)
Austin, Texas, the second-best metro for small businesses, scored a perfect 100.0 in the business climate category. This score was in part thanks to its state-level tax climate, which earned a 6.11 on a scale of zero to 10 (with higher scores indicating better tax climates). In addition, the business survival rate in Austin is 78.4%. Its local economy score, however, is only 52.6.
Des Moines, Iowa, follows. Its perfect 100.0 local economy score is the biggest reason for its rank, boasting a low unemployment rate (3.4%) and low housing costs as a percentage of income (17.8%).
The South shines, while the Northeast is absent from top 10
Notably, none of the 10 best metros are in the Northeast. The South, however, holds half the list, with five metros: Raleigh, Austin, Texas, Durham, N.C., Charleston, S.C., and Charlotte, N.C. North Carolina alone accounts for three of those spots.
Three Midwestern metros — Des Moines, Madison, Wis., and Omaha, Neb. — also made the cut. Meanwhile, Boise, Idaho, and Salt Lake City represent the West in the top 10.
While a metro’s rankings can be a smart place to start when deciding where to start a business, Schulz says they probably shouldn’t be the deciding factor.
“The top-ranked city just may not be the right fit for every business, including yours,” he says. “You have to think about where your customers are, the workers you’ll need, what you can afford and what matters most to your particular company. The best location is ultimately the one that fits your business.”
California’s Central Valley struggles
Three California metros — Fresno, Stockton and Bakersfield — rank at the bottom of the list. California’s relatively weak state-level tax climate score of 3.81 is one contributing factor, alongside lower educational attainment.
Degree shares in all three also sit well below the 38.4% average measured across all 100 metros, at 19.3% in Bakersfield, 23.6% in Fresno and 25.4% in Stockton. Additionally, Bakersfield’s unemployment rate is highest at 8.6%, though Fresno (7.7%) and Stockton (6.4%) are just behind.
Housing costs as a percentage of income also run high among these California metros, at 25.2% in Bakersfield and 24.7% in both Fresno and Stockton.
Still, it’s worth noting that California’s statewide 12.0% business formation rate is second only to Rhode Island’s 12.9%. Further, its startup survival rate ranks fourth. Instead, it’s largely the high costs and taxes and poor degree shares dragging California metros to the bottom.
Schulz believes a weaker labor market can be a mixed bag for a new business.
“Higher unemployment may mean more people are looking for work, but it can still be tough to find candidates with certain skills,” he says. “A struggling local economy may also mean customers have less money to spend. Businesses can absolutely succeed in those places, but owners may need to invest more in training or look beyond the local area for workers and customers.”
Full rankings: Best and worst places to start a new business
| Rank | Metro | Business climate | Entrepreneurship | Local economy | Total score | |||||||||
|---|---|---|---|---|---|---|---|---|---|---|---|---|---|---|
| Tax climate | % of residents with at least a bachelor’s degree | Business survival rate | Category score | % of residents in their prime working years | % of residents who are self-employed | Entrepreneurship rate | Category score | Housing costs as a % of income | Unemployment rate | Business formation rate | Category score | |||
| 1 | Raleigh, NC | 5.62 | 52.5% | 76.1% | 84.3 | 43.0% | 3.9% | 0.29% | 71.5 | 19.8% | 3.2% | 9.1% | 86.5 | 80.8 |
| 2 | Austin, TX | 6.11 | 52.3% | 78.4% | 100.0 | 46.9% | 4.0% | 0.43% | 89.6 | 22.5% | 4.0% | 9.1% | 52.6 | 80.7 |
| 3 | Des Moines, IA | 5.40 | 41.6% | 80.2% | 77.3 | 41.0% | 3.6% | 0.34% | 61.1 | 17.8% | 3.4% | 9.5% | 100.0 | 79.5 |
| 4 | Boise, ID | 5.69 | 38.0% | 76.6% | 58.7 | 40.3% | 5.0% | 0.36% | 80.1 | 20.0% | 3.3% | 11.7% | 86.0 | 74.9 |
| 5 | Durham, NC | 5.62 | 54.7% | 76.1% | 86.3 | 39.6% | 4.3% | 0.29% | 65.2 | 21.9% | 3.4% | 9.1% | 70.1 | 73.9 |
| 6 | Charleston, SC | 5.09 | 42.2% | 82.3% | 75.0 | 41.1% | 5.8% | 0.35% | 86.7 | 21.3% | 3.7% | 7.5% | 53.4 | 71.7 |
| 7 | Salt Lake City, UT | 5.48 | 40.5% | 76.3% | 61.3 | 43.2% | 4.0% | 0.29% | 76.5 | 20.3% | 3.5% | 8.4% | 72.8 | 70.2 |
| 7 | Charlotte, NC | 5.62 | 41.5% | 76.1% | 69.0 | 41.7% | 4.2% | 0.29% | 75.1 | 21.1% | 3.7% | 9.1% | 66.4 | 70.2 |
| 9 | Madison, WI | 5.30 | 52.2% | 79.5% | 84.0 | 40.0% | 3.6% | 0.23% | 46.8 | 20.4% | 2.9% | 8.5% | 79.1 | 70.0 |
| 10 | Omaha, NE | 5.27 | 39.1% | 78.8% | 58.7 | 39.4% | 4.1% | 0.27% | 56.1 | 19.5% | 3.1% | 11.2% | 93.4 | 69.4 |
| 11 | Indianapolis, IN | 5.66 | 39.4% | 79.5% | 76.7 | 40.5% | 3.2% | 0.33% | 50.2 | 19.4% | 3.4% | 8.1% | 79.9 | 68.9 |
| 11 | Nashville, TN | 6.04 | 43.3% | 70.7% | 70.0 | 41.8% | 3.5% | 0.29% | 57.9 | 20.7% | 3.0% | 8.9% | 78.8 | 68.9 |
| 13 | Atlanta, GA | 5.38 | 43.9% | 75.1% | 59.7 | 41.6% | 5.0% | 0.43% | 92.3 | 22.3% | 3.2% | 6.1% | 53.2 | 68.4 |
| 14 | Dallas, TX | 6.11 | 41.0% | 78.4% | 84.7 | 42.4% | 3.9% | 0.43% | 81.9 | 22.6% | 4.6% | 9.1% | 37.8 | 68.1 |
| 15 | San Jose, CA | 3.81 | 56.3% | 80.3% | 66.0 | 43.7% | 3.2% | 0.43% | 68.3 | 21.4% | 4.1% | 12.0% | 60.6 | 65.0 |
| 16 | Provo, UT | 5.48 | 44.0% | 76.3% | 72.0 | 38.2% | 5.3% | 0.29% | 57.9 | 21.1% | 3.7% | 8.4% | 61.6 | 63.8 |
| 17 | Ogden, UT | 5.48 | 35.2% | 76.3% | 36.0 | 41.1% | 4.7% | 0.29% | 77.4 | 19.9% | 3.5% | 8.4% | 75.9 | 63.1 |
| 18 | Miami, FL | 6.84 | 38.7% | 76.0% | 71.3 | 39.5% | 7.9% | 0.57% | 87.3 | 29.3% | 3.7% | 6.9% | 29.6 | 62.7 |
| 19 | San Francisco, CA | 3.81 | 53.8% | 80.3% | 64.0 | 43.1% | 3.7% | 0.43% | 80.1 | 23.5% | 4.4% | 12.0% | 41.0 | 61.7 |
| 20 | Denver, CO | 4.97 | 51.6% | 75.9% | 54.3 | 45.7% | 4.8% | 0.33% | 90.0 | 22.9% | 4.1% | 7.7% | 35.4 | 59.9 |
| 21 | Orlando, FL | 6.84 | 38.5% | 76.0% | 70.7 | 42.0% | 5.7% | 0.57% | 100.0 | 26.4% | 4.7% | 6.9% | 8.5 | 59.7 |
| 22 | San Diego, CA | 3.81 | 45.2% | 80.3% | 57.3 | 42.2% | 4.7% | 0.43% | 93.7 | 26.5% | 4.7% | 12.0% | 27.2 | 59.4 |
| 23 | Greenville, SC | 5.09 | 36.5% | 82.3% | 52.3 | 38.0% | 3.7% | 0.35% | 41.9 | 17.7% | 3.7% | 7.5% | 82.5 | 58.9 |
| 24 | Seattle, WA | 4.21 | 48.5% | 82.5% | 66.3 | 45.5% | 4.1% | 0.30% | 80.5 | 23.2% | 5.0% | 10.7% | 28.0 | 58.3 |
| 25 | Kansas City, MO | 5.62 | 40.7% | 74.1% | 59.7 | 39.9% | 3.5% | 0.33% | 49.3 | 19.9% | 3.8% | 8.2% | 65.1 | 58.0 |
| 26 | Fayetteville, AR | 4.93 | 38.2% | 76.6% | 34.0 | 40.7% | 3.3% | 0.33% | 52.5 | 18.3% | 3.5% | 8.1% | 87.3 | 57.9 |
| 27 | Jacksonville, FL | 6.84 | 38.3% | 76.0% | 70.0 | 39.7% | 5.2% | 0.57% | 85.5 | 22.8% | 4.9% | 6.9% | 17.5 | 57.7 |
| 28 | Minneapolis, MN | 4.44 | 45.9% | 79.4% | 57.0 | 40.2% | 4.0% | 0.21% | 56.6 | 19.7% | 4.4% | 9.2% | 58.7 | 57.4 |
| 29 | Spokane, WA | 4.21 | 33.7% | 82.5% | 21.7 | 39.6% | 4.8% | 0.30% | 69.7 | 20.3% | 3.5% | 10.7% | 80.4 | 57.3 |
| 30 | Houston, TX | 6.11 | 37.3% | 78.4% | 68.0 | 41.8% | 3.9% | 0.43% | 80.1 | 23.1% | 5.1% | 9.1% | 23.5 | 57.2 |
| 31 | Columbia, SC | 5.09 | 37.2% | 82.3% | 55.7 | 38.4% | 4.3% | 0.35% | 56.8 | 19.8% | 4.0% | 7.5% | 58.2 | 56.9 |
| 32 | St. Louis, MO | 5.62 | 39.5% | 74.1% | 55.0 | 38.7% | 3.2% | 0.33% | 33.5 | 18.0% | 3.8% | 8.2% | 81.5 | 56.7 |
| 33 | Knoxville, TN | 6.04 | 34.2% | 70.7% | 33.3 | 37.6% | 3.7% | 0.29% | 35.7 | 18.3% | 3.2% | 8.9% | 96.3 | 55.1 |
| 33 | Chicago, IL | 4.78 | 43.1% | 79.7% | 60.3 | 40.6% | 4.6% | 0.31% | 75.3 | 21.0% | 4.9% | 7.8% | 29.6 | 55.1 |
| 35 | Milwaukee, WI | 5.30 | 40.9% | 79.5% | 68.7 | 38.7% | 3.2% | 0.23% | 25.1 | 19.9% | 3.8% | 8.5% | 67.5 | 53.8 |
| 36 | Richmond, VA | 5.07 | 42.9% | 76.0% | 50.7 | 40.4% | 3.9% | 0.25% | 57.7 | 21.9% | 3.8% | 8.1% | 52.4 | 53.6 |
| 37 | Columbus, OH | 4.78 | 40.3% | 78.7% | 47.0 | 41.6% | 3.3% | 0.21% | 45.2 | 20.5% | 3.2% | 6.9% | 68.3 | 53.5 |
| 38 | Portland, OR | 4.92 | 43.5% | 73.3% | 41.7 | 44.0% | 4.0% | 0.37% | 82.1 | 22.4% | 4.9% | 11.3% | 36.0 | 53.3 |
| 39 | Albany, NY | 3.65 | 44.4% | 79.6% | 45.3 | 37.7% | 3.2% | 0.42% | 30.3 | 19.6% | 3.7% | 9.6% | 81.0 | 52.2 |
| 39 | New York, NY | 3.65 | 45.0% | 79.6% | 46.0 | 40.2% | 4.4% | 0.42% | 77.4 | 24.7% | 4.3% | 9.6% | 33.3 | 52.2 |
| 41 | Los Angeles, CA | 3.81 | 39.0% | 80.3% | 38.7 | 42.0% | 5.0% | 0.43% | 95.5 | 27.5% | 5.0% | 12.0% | 19.3 | 51.2 |
| 42 | Philadelphia, PA | 4.91 | 43.3% | 78.8% | 61.3 | 39.2% | 3.7% | 0.22% | 43.0 | 21.1% | 4.2% | 8.4% | 47.9 | 50.7 |
| 43 | Phoenix, AZ | 5.52 | 36.9% | 79.0% | 56.7 | 40.2% | 4.0% | 0.35% | 68.6 | 22.1% | 4.8% | 7.9% | 26.5 | 50.6 |
| 44 | Tampa, FL | 6.84 | 36.5% | 76.0% | 60.0 | 39.1% | 5.3% | 0.57% | 80.5 | 24.5% | 4.8% | 6.9% | 10.6 | 50.4 |
| 45 | San Antonio, TX | 6.11 | 32.8% | 78.4% | 50.0 | 41.4% | 3.1% | 0.43% | 57.5 | 21.9% | 4.7% | 9.1% | 41.0 | 49.5 |
| 46 | Pittsburgh, PA | 4.91 | 39.8% | 78.8% | 49.3 | 37.4% | 3.0% | 0.22% | 9.0 | 16.7% | 3.7% | 8.4% | 89.7 | 49.3 |
| 47 | Chattanooga, TN | 6.04 | 32.4% | 70.7% | 27.3 | 38.8% | 2.9% | 0.29% | 24.9 | 18.1% | 3.3% | 8.9% | 95.2 | 49.1 |
| 48 | North Port, FL | 6.84 | 40.2% | 76.0% | 77.3 | 30.3% | 7.4% | 0.57% | 61.5 | 24.0% | 5.0% | 6.9% | 7.9 | 48.9 |
| 49 | Birmingham, AL | 4.80 | 35.9% | 77.1% | 20.3 | 38.6% | 4.1% | 0.26% | 47.3 | 19.1% | 3.5% | 7.8% | 77.2 | 48.3 |
| 50 | Grand Rapids, MI | 5.44 | 38.3% | 77.6% | 54.3 | 39.0% | 3.2% | 0.25% | 29.2 | 17.7% | 4.3% | 6.3% | 60.8 | 48.1 |
| 51 | Colorado Springs, CO | 4.97 | 42.8% | 75.9% | 43.7 | 41.4% | 4.2% | 0.33% | 76.5 | 23.9% | 4.3% | 7.7% | 23.8 | 48.0 |
| 52 | Little Rock, AR | 4.93 | 35.0% | 76.6% | 19.3 | 39.1% | 4.1% | 0.33% | 60.2 | 18.8% | 4.2% | 8.1% | 63.0 | 47.5 |
| 53 | Oklahoma City, OK | 5.37 | 35.3% | 73.5% | 22.3 | 39.7% | 4.4% | 0.33% | 70.1 | 20.0% | 4.3% | 8.0% | 49.5 | 47.3 |
| 54 | Syracuse, NY | 3.65 | 37.4% | 79.6% | 20.0 | 35.8% | 3.9% | 0.42% | 38.9 | 18.3% | 4.1% | 9.6% | 81.5 | 46.8 |
| 54 | Winston-Salem, NC | 5.62 | 33.4% | 76.1% | 35.7 | 37.3% | 3.6% | 0.29% | 28.1 | 19.4% | 3.8% | 9.1% | 76.5 | 46.8 |
| 56 | Washington, DC | 4.14 | 55.5% | 67.1% | 35.3 | 41.8% | 3.6% | 0.28% | 60.2 | 20.9% | 4.0% | 6.0% | 44.2 | 46.6 |
| 57 | El Paso, TX | 6.11 | 26.6% | 78.4% | 42.0 | 40.0% | 3.2% | 0.43% | 54.3 | 21.0% | 4.8% | 9.1% | 42.6 | 46.3 |
| 58 | Jackson, MS | 5.12 | 32.5% | 77.9% | 21.7 | 38.3% | 4.2% | 0.28% | 48.0 | 18.7% | 3.6% | 5.9% | 67.7 | 45.8 |
| 59 | Palm Bay, FL | 6.84 | 35.7% | 76.0% | 55.3 | 35.2% | 5.2% | 0.57% | 59.7 | 22.6% | 4.9% | 6.9% | 19.0 | 44.7 |
| 60 | Boston, MA | 4.45 | 53.0% | 76.4% | 51.7 | 40.4% | 3.1% | 0.22% | 36.7 | 22.8% | 4.3% | 11.4% | 45.5 | 44.6 |
| 61 | Greensboro, NC | 5.62 | 32.1% | 76.1% | 31.0 | 37.3% | 4.0% | 0.29% | 38.5 | 20.0% | 4.1% | 9.1% | 63.8 | 44.4 |
| 62 | Harrisburg, PA | 4.91 | 36.4% | 78.8% | 32.0 | 38.3% | 2.4% | 0.22% | 11.3 | 18.6% | 3.5% | 8.4% | 85.4 | 42.9 |
| 63 | Sacramento, CA | 3.81 | 38.3% | 80.3% | 36.0 | 39.8% | 3.7% | 0.43% | 65.6 | 24.1% | 5.0% | 12.0% | 26.7 | 42.8 |
| 64 | Buffalo, NY | 3.65 | 38.3% | 79.6% | 25.3 | 37.5% | 3.4% | 0.42% | 31.2 | 18.5% | 4.4% | 9.6% | 70.4 | 42.3 |
| 64 | Tucson, AZ | 5.52 | 37.9% | 79.0% | 62.0 | 35.5% | 4.0% | 0.35% | 40.0 | 20.8% | 5.6% | 7.9% | 24.9 | 42.3 |
| 66 | Cleveland, OH | 4.78 | 34.7% | 78.7% | 21.0 | 37.4% | 3.6% | 0.21% | 22.6 | 18.7% | 3.1% | 6.9% | 83.1 | 42.2 |
| 67 | Rochester, NY | 3.65 | 38.9% | 79.6% | 27.3 | 36.9% | 3.5% | 0.42% | 28.1 | 19.2% | 4.2% | 9.6% | 70.4 | 41.9 |
| 68 | Oxnard, CA | 3.81 | 37.6% | 80.3% | 31.3 | 38.5% | 4.3% | 0.43% | 64.3 | 24.9% | 4.7% | 12.0% | 29.9 | 41.8 |
| 69 | Baltimore, MD | 4.20 | 45.3% | 75.5% | 34.7 | 39.5% | 3.7% | 0.28% | 49.8 | 20.9% | 4.2% | 6.2% | 38.6 | 41.0 |
| 70 | Louisville, KY | 5.20 | 33.4% | 78.7% | 30.3 | 39.5% | 3.2% | 0.34% | 43.0 | 18.5% | 4.8% | 7.2% | 49.5 | 40.9 |
| 71 | Akron, OH | 4.78 | 35.9% | 78.7% | 26.3 | 37.4% | 3.5% | 0.21% | 17.6 | 18.3% | 3.6% | 6.9% | 78.3 | 40.7 |
| 71 | Baton Rouge, LA | 5.06 | 30.9% | 80.4% | 28.0 | 38.3% | 3.6% | 0.40% | 42.1 | 19.3% | 4.1% | 5.4% | 51.9 | 40.7 |
| 73 | Dayton, OH | 4.78 | 34.6% | 78.7% | 20.3 | 37.4% | 3.3% | 0.21% | 14.9 | 18.3% | 3.5% | 6.9% | 82.0 | 39.1 |
| 73 | Honolulu, HI | 4.56 | 40.1% | 77.1% | 33.0 | 39.1% | 3.6% | 0.26% | 40.5 | 24.1% | 2.8% | 5.9% | 43.9 | 39.1 |
| 75 | Kiryas Joel, NY | 3.65 | 37.1% | 79.6% | 18.0 | 37.0% | 4.4% | 0.42% | 50.7 | 23.5% | 4.0% | 9.6% | 48.1 | 38.9 |
| 76 | McAllen, TX | 6.11 | 21.3% | 78.4% | 38.7 | 37.6% | 2.9% | 0.43% | 26.7 | 18.2% | 6.8% | 9.1% | 51.1 | 38.8 |
| 77 | Tulsa, OK | 5.37 | 31.9% | 73.5% | 11.0 | 38.9% | 4.0% | 0.33% | 55.2 | 19.6% | 4.6% | 8.0% | 48.4 | 38.2 |
| 78 | Virginia Beach, VA | 5.07 | 37.0% | 76.0% | 27.3 | 39.4% | 3.7% | 0.25% | 46.4 | 23.3% | 3.9% | 8.1% | 40.2 | 38.0 |
| 79 | Cape Coral, FL | 6.84 | 32.4% | 76.0% | 44.7 | 33.0% | 6.7% | 0.57% | 61.5 | 23.6% | 5.2% | 6.9% | 6.9 | 37.7 |
| 80 | Bridgeport, CT | 4.17 | 50.9% | 78.2% | 48.7 | 38.1% | 4.5% | 0.28% | 49.3 | 22.9% | 5.5% | 8.0% | 14.0 | 37.3 |
| 81 | Cincinnati, OH | 4.78 | 37.1% | 78.7% | 31.7 | 38.1% | 2.7% | 0.21% | 8.6 | 18.8% | 3.7% | 6.9% | 71.4 | 37.2 |
| 82 | Albuquerque, NM | 5.09 | 35.9% | 77.0% | 31.0 | 39.3% | 3.1% | 0.45% | 44.1 | 18.5% | 5.5% | 6.8% | 36.2 | 37.1 |
| 83 | Deltona, FL | 6.84 | 29.9% | 76.0% | 40.0 | 33.5% | 6.2% | 0.57% | 61.5 | 23.2% | 5.4% | 6.9% | 9.5 | 37.0 |
| 84 | Wichita, KS | 5.22 | 32.9% | 76.4% | 21.0 | 37.9% | 2.9% | 0.23% | 11.5 | 18.0% | 4.5% | 9.4% | 72.2 | 34.9 |
| 85 | Detroit, MI | 5.44 | 35.6% | 77.6% | 39.0 | 38.8% | 3.6% | 0.25% | 36.4 | 19.1% | 6.0% | 6.3% | 28.0 | 34.5 |
| 86 | Memphis, TN | 6.04 | 31.9% | 70.7% | 25.3 | 39.0% | 3.6% | 0.29% | 43.0 | 22.6% | 4.7% | 8.9% | 33.9 | 34.1 |
| 87 | Lakeland, FL | 6.84 | 25.2% | 76.0% | 36.7 | 38.8% | 4.0% | 0.57% | 64.7 | 24.2% | 5.8% | 6.9% | 0.0 | 33.8 |
| 88 | New Orleans, LA | 5.06 | 34.2% | 80.4% | 38.0 | 39.1% | 3.8% | 0.40% | 54.3 | 24.6% | 4.5% | 5.4% | 8.5 | 33.6 |
| 89 | Augusta, GA | 5.38 | 29.8% | 75.1% | 10.3 | 38.6% | 2.9% | 0.43% | 33.5 | 19.5% | 4.0% | 6.1% | 54.8 | 32.9 |
| 90 | Las Vegas, NV | 5.34 | 28.2% | 75.9% | 8.3 | 41.8% | 4.1% | 0.38% | 80.5 | 25.1% | 5.4% | 8.7% | 7.9 | 32.2 |
| 91 | Allentown, PA | 4.91 | 33.8% | 78.8% | 23.3 | 37.4% | 3.4% | 0.22% | 17.2 | 20.9% | 4.1% | 8.4% | 54.2 | 31.6 |
| 92 | Worcester, MA | 4.45 | 40.2% | 76.4% | 31.7 | 38.9% | 2.8% | 0.22% | 17.6 | 21.9% | 4.8% | 11.4% | 42.3 | 30.5 |
| 93 | Hartford, CT | 4.17 | 43.2% | 78.2% | 40.7 | 37.8% | 3.2% | 0.28% | 21.3 | 21.0% | 5.8% | 8.0% | 23.0 | 28.3 |
| 94 | Riverside, CA | 3.81 | 25.2% | 80.3% | 2.7 | 40.3% | 3.6% | 0.43% | 65.6 | 26.1% | 5.7% | 12.0% | 15.1 | 27.8 |
| 95 | Toledo, OH | 4.78 | 31.6% | 78.7% | 10.3 | 37.0% | 2.1% | 0.21% | 0.0 | 18.0% | 4.0% | 6.9% | 72.5 | 27.6 |
| 96 | Providence, RI | 4.69 | 36.5% | 77.9% | 19.0 | 38.5% | 3.1% | 0.18% | 15.6 | 23.6% | 4.2% | 12.9% | 45.5 | 26.7 |
| 97 | New Haven, CT | 4.17 | 42.5% | 78.2% | 38.0 | 37.5% | 3.6% | 0.28% | 28.5 | 23.4% | 5.9% | 8.0% | 7.7 | 24.7 |
| 98 | Bakersfield, CA | 3.81 | 19.3% | 80.3% | 0.0 | 39.4% | 3.7% | 0.43% | 62.0 | 25.2% | 8.6% | 12.0% | 11.4 | 24.5 |
| 99 | Stockton, CA | 3.81 | 25.4% | 80.3% | 3.3 | 40.4% | 3.0% | 0.43% | 52.0 | 24.7% | 6.4% | 12.0% | 15.6 | 23.6 |
| 100 | Fresno, CA | 3.81 | 23.6% | 80.3% | 1.3 | 39.2% | 3.0% | 0.43% | 41.6 | 24.7% | 7.7% | 12.0% | 14.6 | 19.2 |
Choosing the right market for your business
Where you launch or expand a small business can have a major impact on its prospects and its costs. We offer the following advice:
- Start with workers and customers. “Look at whether the area has the talent your business needs and a large enough pool of potential customers,” Schulz says. “Those fundamentals should be among the first things you assess.”
- Calculate the true cost of operating, and set a budget. “Compare wages, commercial real estate, taxes, insurance and regulatory costs,” he says. “These expenses can vary significantly from one location to another and have a real impact on a growing business.”
- Focus on the right fit. “No city will be perfect,” he says. “Instead of searching for one that checks every box, prioritize the factors that matter most to your business and look for a market whose strengths align with those needs.”
Methodology
LendingTree analysts compared nine metrics across the 100 largest U.S. metros by population to determine the best metros to start a small business.
Analysts created three scores using the data:
- Business climate
- Entrepreneurship
- Local economy
Analysts averaged the three scores to create a final score and rank the metros. Here are the categories and metrics within them, representing the latest available data at the time of research. Metrics are metro-based unless otherwise noted:
Business climate score
- Tax climate: The 2026 State Tax Competitiveness Index score, measured at the state level. Corporate, individual income, sales, property and unemployment insurance taxes factor into the score. Tax Foundation, October 2025. (Full weight)
- Proportion of residents 25 and older with at least a bachelor’s degree: U.S. Census Bureau 2024 American Community Survey (ACS) one-year estimates. (Full weight)
- Business survival rate: The percentage of new businesses still operating after a year, measured at the state level. Kauffman Indicators of Entrepreneurship, May 2026 report using 2025 data. (Half weight)
Entrepreneurship score
- Proportion of residents in their prime working years: The percentage of residents ages 25 to 54. U.S. Census Bureau 2024 ACS one-year estimates. (Full weight)
- Proportion of residents who are self-employed: The percentage of employed civilian residents ages 16 and older who own incorporated businesses. U.S. Census Bureau 2024 ACS with one-year estimates. (Full weight)
- Entrepreneurship rate: The percentage of residents who start a business, measured at the state level using a 2023-to-2025 trailing average. Kauffman Indicators of Entrepreneurship, May 2026 report. (Half weight)
Local economy score
- Housing costs as a percentage of income: U.S. Census Bureau 2024 ACS with one-year estimates. (Full weight)
- Unemployment rate: U.S. Bureau of Labor Statistics, preliminary July 2026 data, not seasonally adjusted. (Full weight)
- Business formation rate: The share of business applications that become businesses with employees within eight quarters of filing, measured at the state level. The 2025 application cohort includes projected outcomes. Kauffman Indicators of Entrepreneurship, May 2026 report. (Half weight)
Compare business loan offers